Construction industry productivity growth rose slightly this year, but the long-term trend remains flat
Construction industry multifactor productivity (MFP) rose by 2% in 2023-24, reversing the decline recorded in 2022-23.35 This short-term rebound, however, is not enough to signal a structural shift in industry productivity, as year-to-year MFP changes can be volatile and influenced by assumptions about capital utilisation.
The long-term construction industry trend remains flat, remaining slightly below mid-1990s levels and well below the early 2010s peak. Over the past decade, the sector has consistently lagged productivity growth across the broader economy.
Figure 22: Gross value added multifactor productivity – comparison of construction and comparable industries (1994–95 to 2023–24)
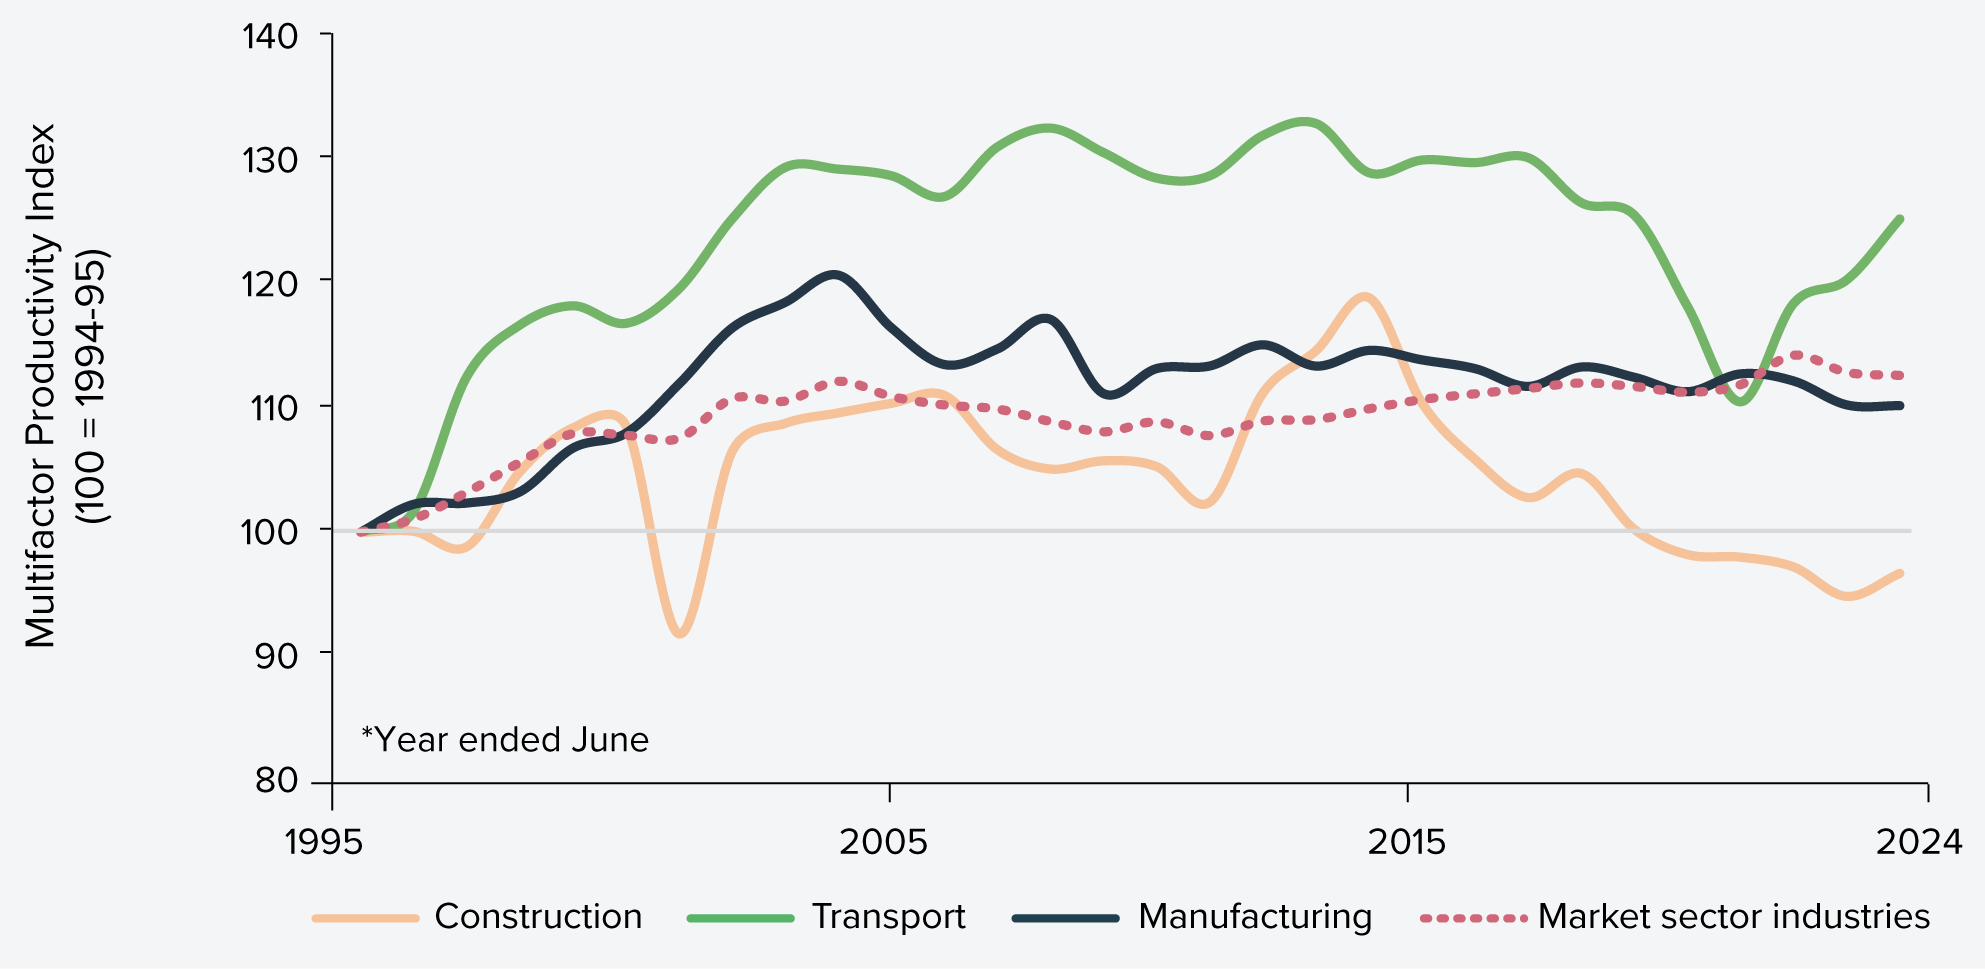
Source: Australian Bureau of Statistics36
Approximately 41% of infrastructure construction is completed by subcontractors
Subcontracting now delivers 41% of infrastructure construction. This is calculated from a bespoke analysis of ABS data, which estimates that 11% of civil and engineering construction and non-residential buildings income comes from subcontracting. At the same time, 30% of costs flow to external construction services.37 As such, nearly half of all infrastructure work is handled by firms beyond the principal contractor, especially lower-tier and specialist providers.
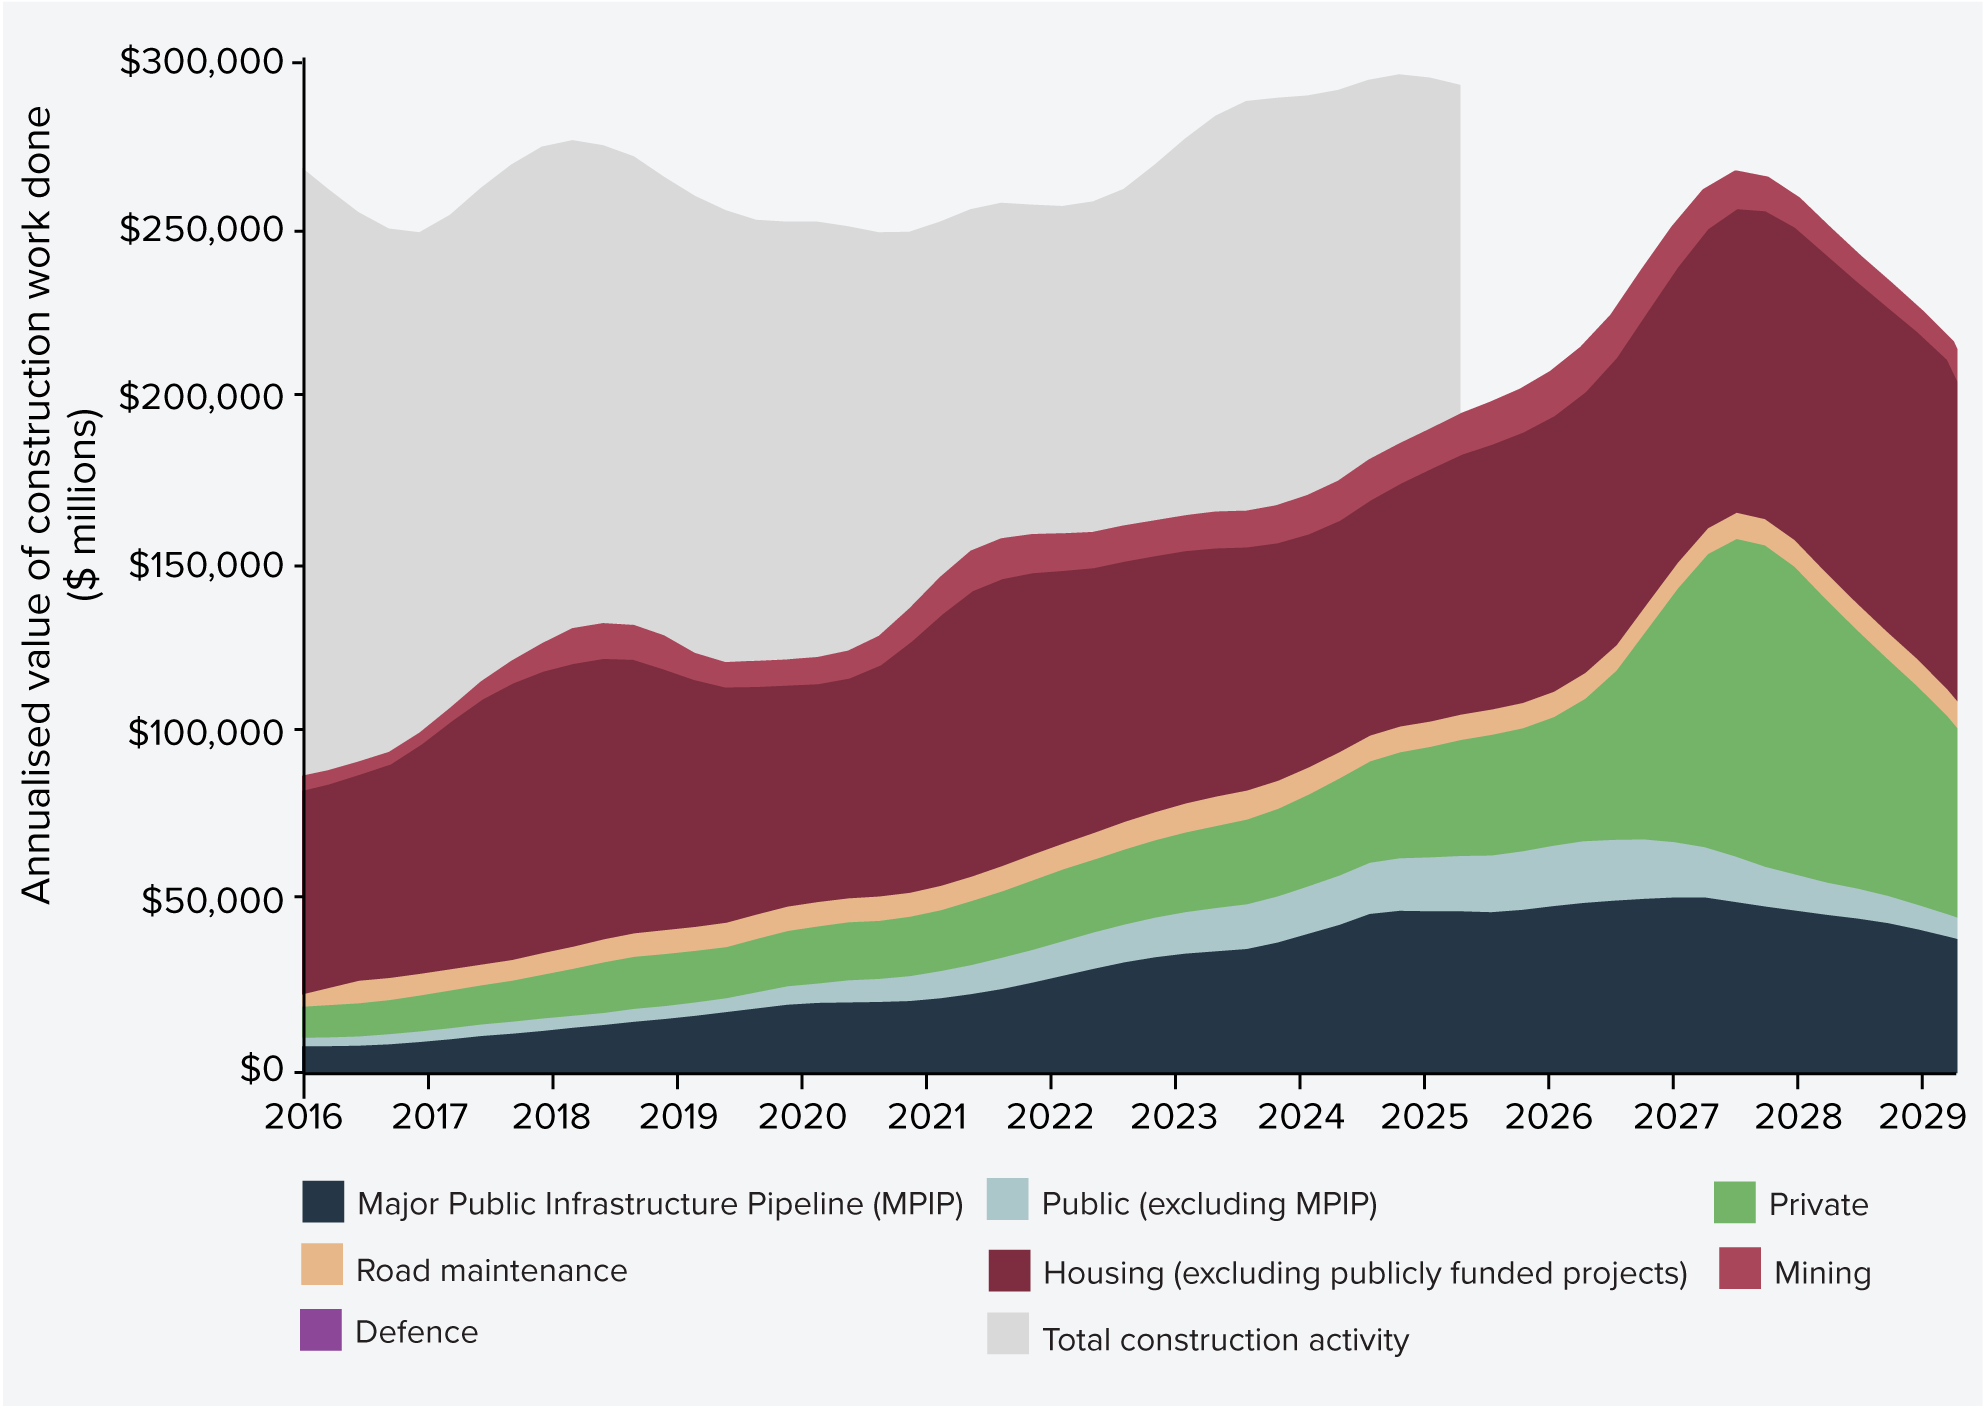
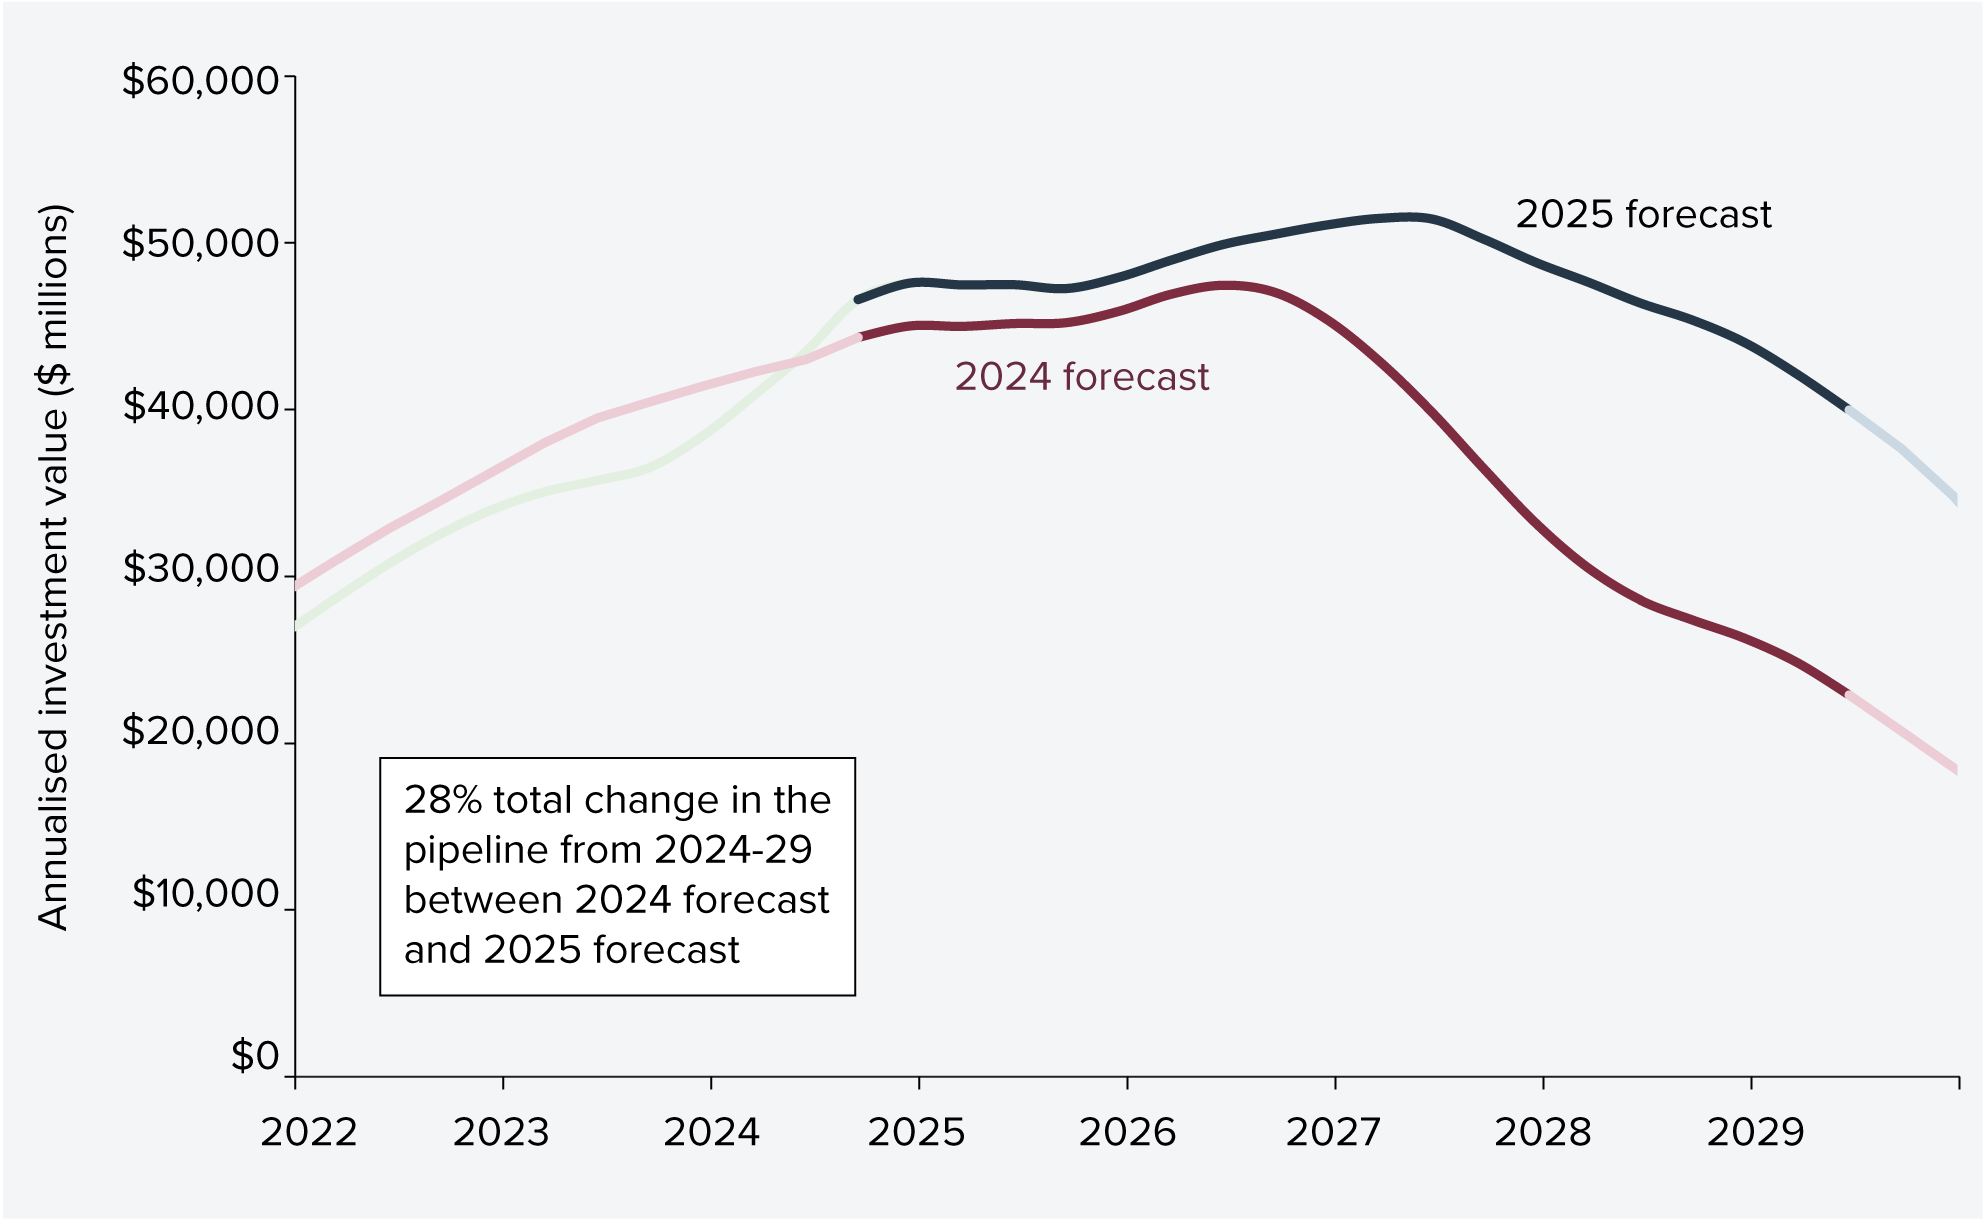
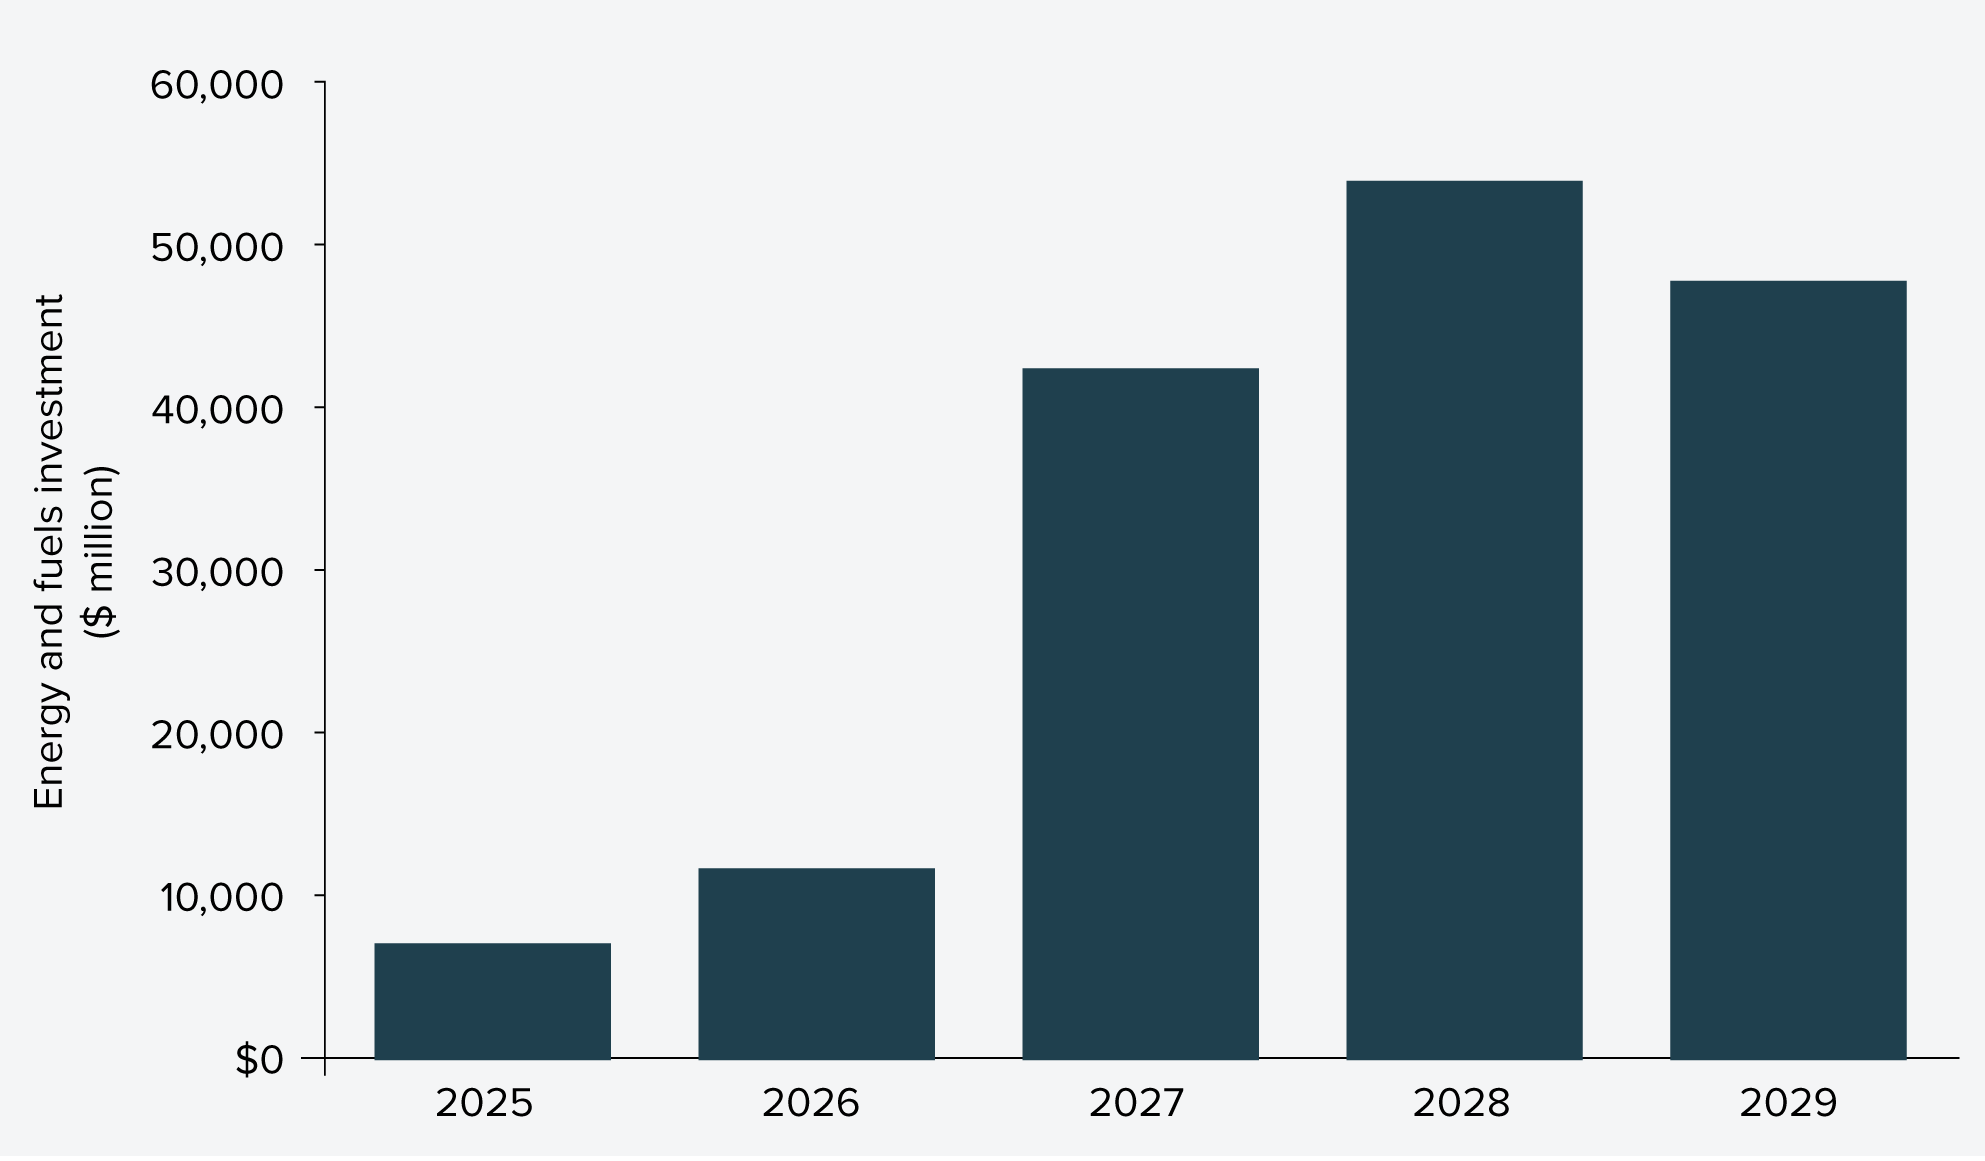
In the context of the current Major Public Infrastructure Pipeline, this means over $100 billion of public infrastructure works funded over the five-year outlook (2024-25 to 2028-29) will be delivered by firms beyond the principal contractor.
Industry stakeholders report a sharp rise in subcontracting over recent decades, driven by fluctuating workloads, risk management, specialist skill needs, regulatory pressures, and evolving project management styles. The growing scale and complexity of projects - often delivered via joint ventures - has further accelerated this shift.
Industry believes subcontracting can deliver productivity benefits, but highlight the need for a more balanced approach to self-performance to reduce integration risk
Infrastructure Australia’s Industry Confidence Survey this year found businesses see the top benefits from subcontracting are access to workers and specialist expertise (voted by over half of businesses surveyed), followed by reduced management and administrative workload (29%) and risk transfer (30%).
There is, however, a range of challenges when managing subcontractors. Figure 23 shows that respondents surveyed this year reported that cost overruns are the most common challenge encountered (reported by 45%), followed by quality inconsistencies (40%), and coordination difficulties (34%). Other challenges encountered include project delays and regulatory compliance (voted by 23% and 16% of surveyed firms).
Optimising subcontracting arrangements is therefore critical to reducing delivery risks and improving productivity. This means moving beyond transactional contracting to models that foster collaboration, transparency, and shared accountability. Better integration between head contractors and subcontractors can reduce costly rework, improve safety outcomes, and enhance workforce stability.
Figure 23: Challenges experienced when managing subcontracting or labour hire relationships
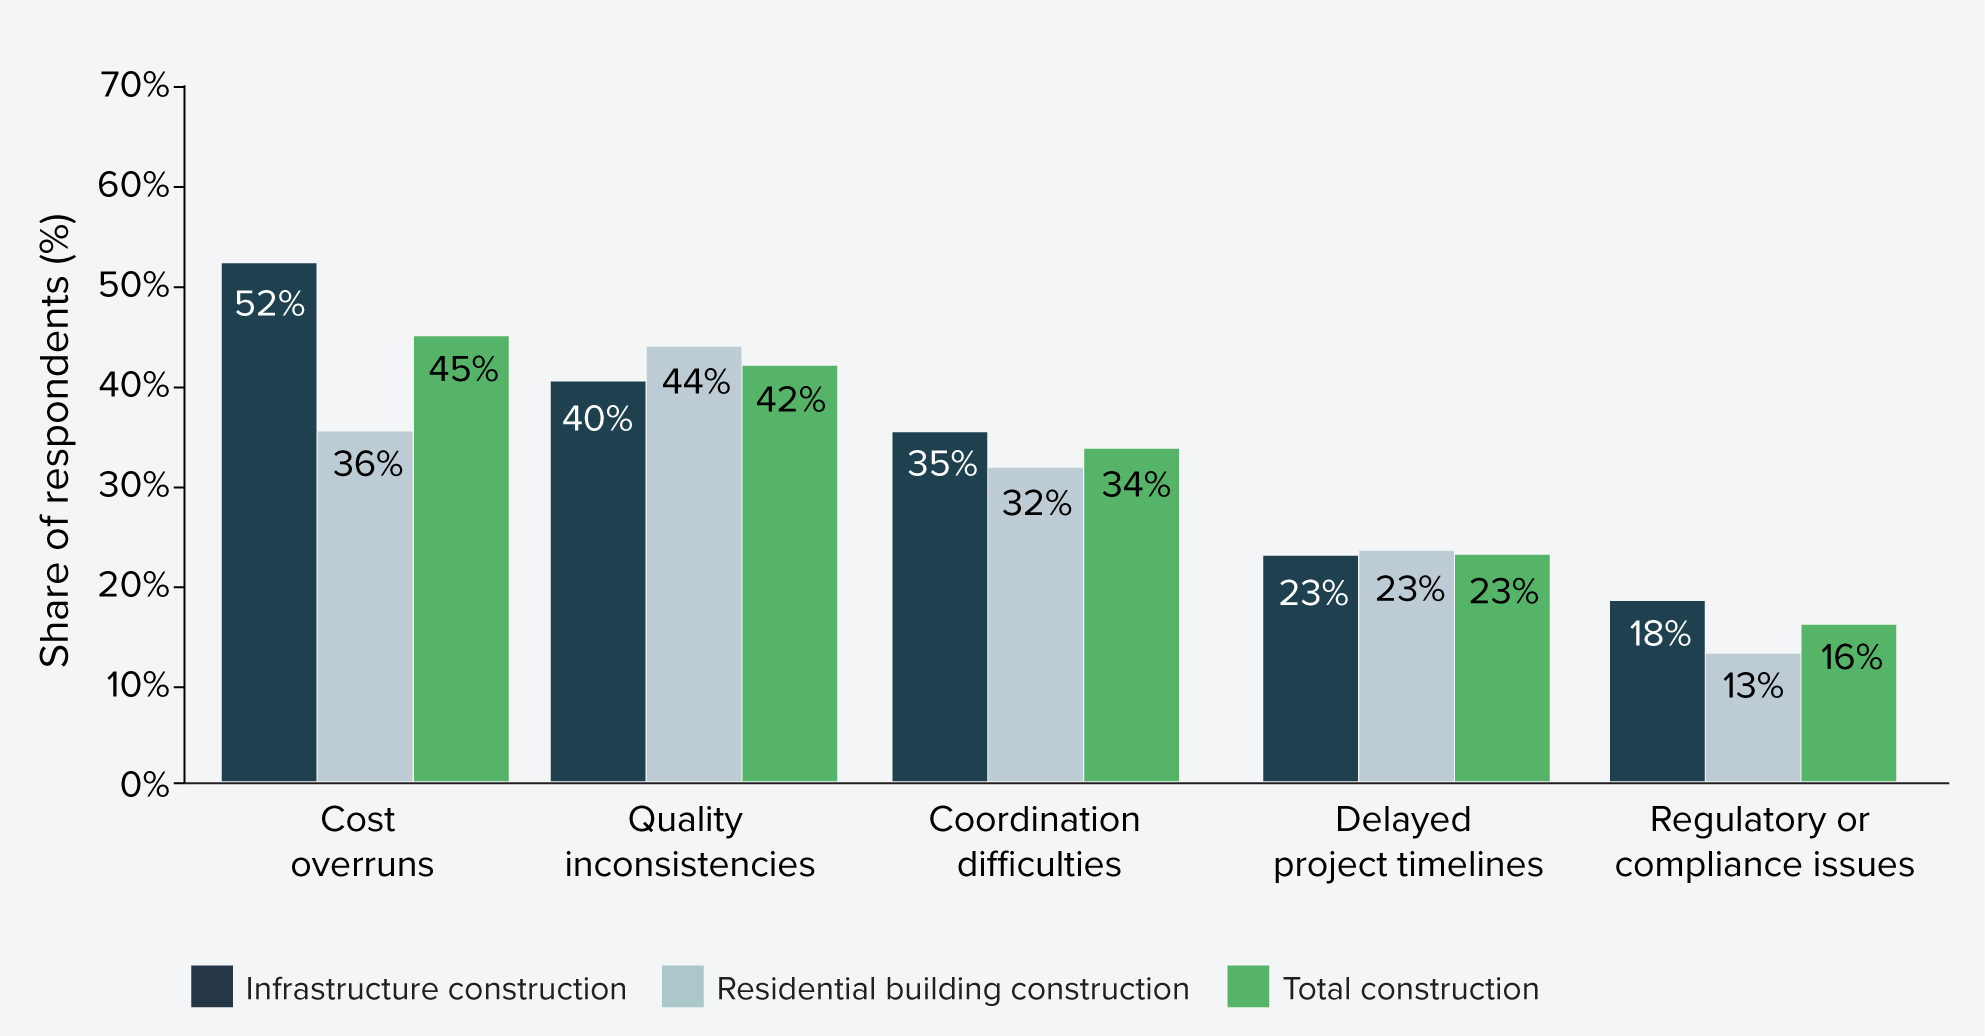
Source: Infrastructure Australia Industry Confidence Survey (2025)
At the same time, strengthening self-performance by Tier 1 contractors is equally important. Maintaining in-house delivery capability supports better sequencing, resource flexibility, and knowledge retention - factors that underpin productivity and resilience. Over-reliance on subcontracting can erode these capabilities, reduce training opportunities, and increase supervisory overheads for head contractors.
However, in depth interviews with contactors revealed that while subcontracting can deliver flexibility and cost benefits, heavy reliance on it has raised concerns about declining self-performance, particularly among Tier 1 contractors that have shifted from delivery to project management roles. Self-performing key tasks supports better sequencing, resource flexibility, and knowledge transfer – factors critical for productivity.
Stakeholders have linked reduced self-performance to weaker outcomes. Extensive subcontracting can dilute training opportunities, strain smaller firms, and force Tier 1 contractors to add costly layers of supervision. Aggressive risk transfer down the supply chain further compounds these issues, creating inefficiencies and integration risks.
Data collection and setting benchmarks are the first steps to unpack impact of subcontracting on productivity
There is no consistent project-level data on subcontracting practices and self-performance. Current reporting does not capture the dynamics of subcontracting – such as the proportion of work subcontracted, the distribution of risk, or the indirect costs associated with layered contracting. Nor does it track the extent of self-performance and its correlation with project outcomes. Without this visibility, it is difficult to identify best practices or diagnose systemic inefficiencies. This aligns with last year’s industry findings, where only 8% of firms reported measuring rework as part of their productivity metrics – highlighting a persistent gap in performance tracking.
Capturing standardised data at the project level can help with developing benchmarks to track the health of the subcontracting ecosystem. This could include metrics on subcontractor engagement, indirect labour costs, and rework rates, alongside contextual project parameters, such as contract type, procurement model, and use of modern construction methods. Establishing these benchmarks will enable governments and industry to compare performance across projects, identify patterns, and target interventions where they will have the greatest impact.
By agreeing on a core set of economic and performance measures – such as budgeted vs actual cost, planned vs actual time, and indirect labour costs relative to total labour costs – the workstream will provide a foundation for evidence-based policy and procurement reform. Over time, these insights could inform strategies to optimise subcontracting arrangements, strengthen self-performance, reduce integration risk, and ultimately lift productivity across the sector.
Workforce diversity
Women make up approximately 13% of the construction industry workforce in Australia and only 4% of trades workers – a trend that has remained stubbornly consistent over the last 40 years since the ABS started collecting Labour Force Survey data.
Looking at a smaller subset of companies with more than 100 employees reporting to the Workplace Gender Equality Agency (WGEA), the construction industry has the highest gender pay gap across all other industries. Figure 24 shows that the median total remuneration gender pay gap for Construction is 26.3%, higher than comparable industries such as Electricity, Gas, Water and Waste Services at 20.4%, mining at 19.9%, and Transport Postal and Logistics at 11.9%, and significantly higher than the all-industry average at 8.9%.
Figure 24: Equal remuneration and gender pay gap for the construction industry (2023-24)
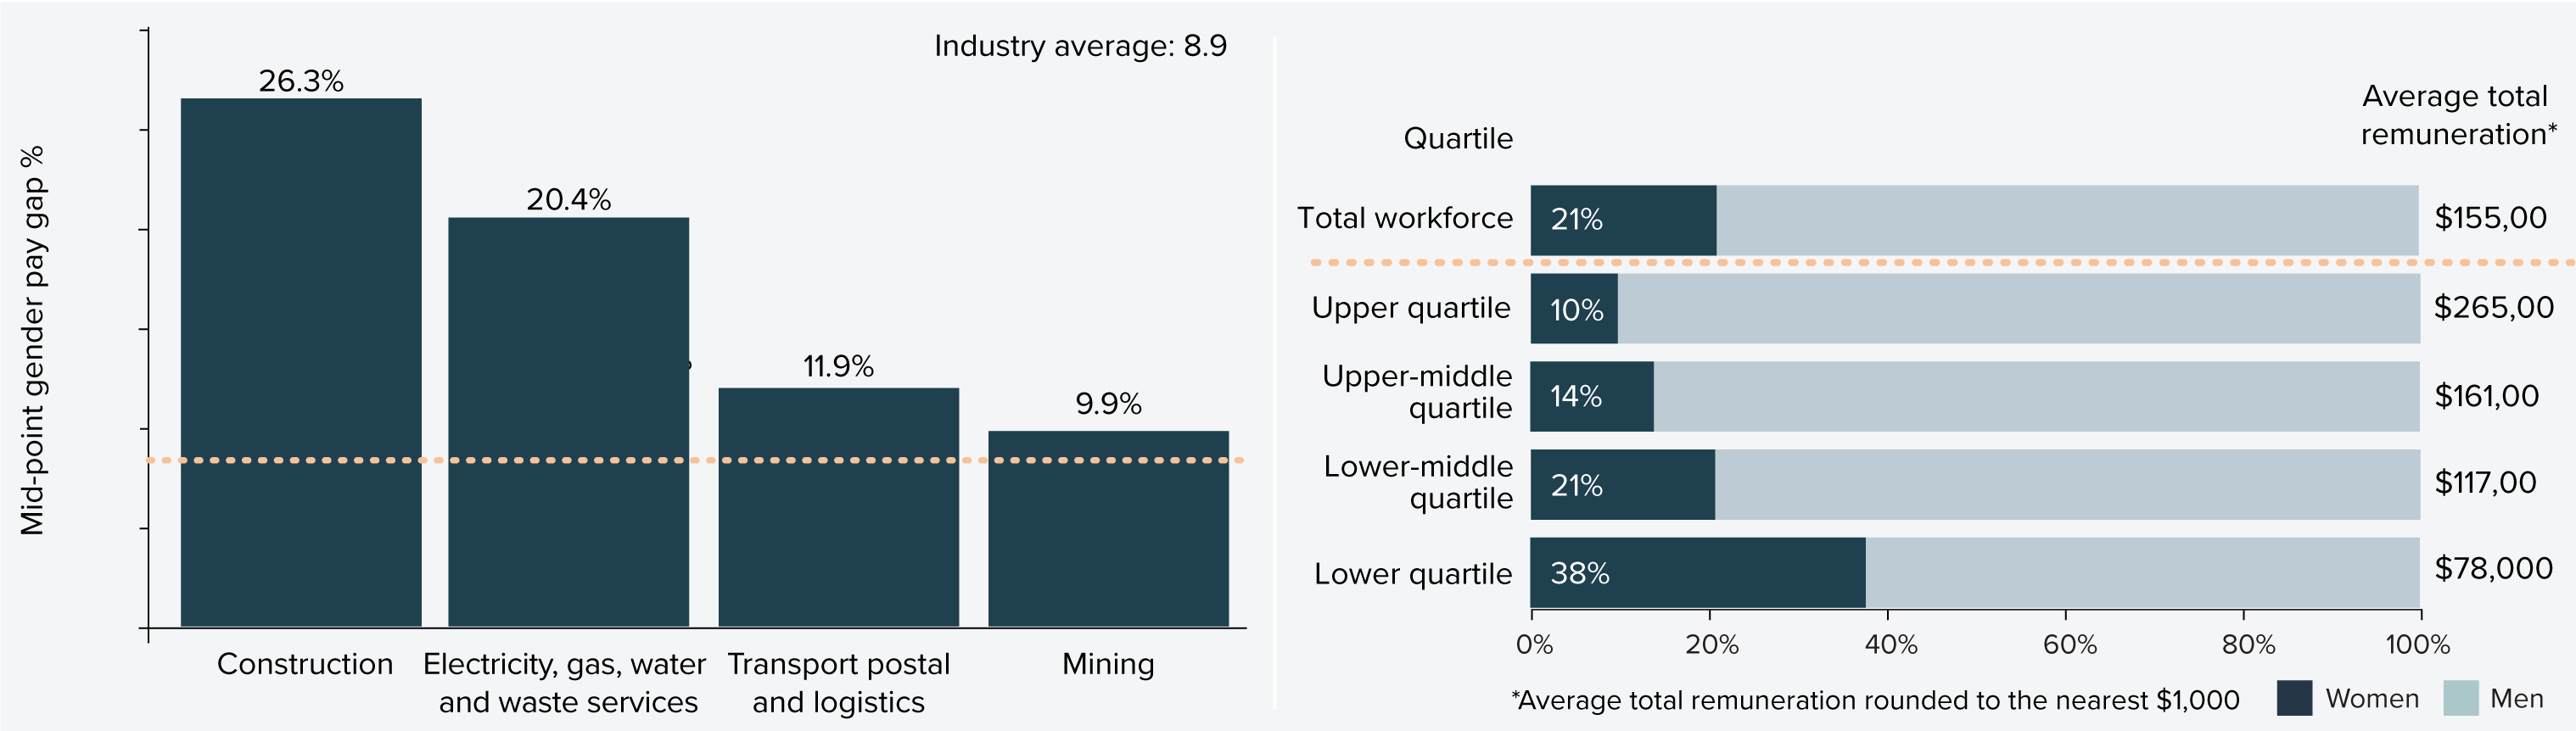
Source: WGEA Industry Data Explorer (2025)40
Women in construction are overrepresented in the lower pay quartiles, part-time work and in lower paid roles. Based on WGEA data in Figure 24, one in five (21%) employees of construction companies are women, yet they make up:
- 38% of workers in the lowest quartile of pay
- 72% of the part-time staff; and
- 6% of technicians and trades workers
This suggests the pay gap is strongly driven by occupation and hierarchical segregation, with fewer women in high earning roles and in leadership positions.
Less than half of industry have invested in diversity, retention or attraction programs in the last 12 months
Despite poor workforce diversity and sustained difficulty in attracting and retaining workers in the construction industry, Infrastructure Australia’s Industry Confidence Survey this year found less than half (46%) of organisations have invested in workforce diversity, retention or attraction programs over the last 12 months, as shown in Figure 25. This contrasts sharply with the same cohort’s stronger focus on other types of productivity-lifting initiatives. Around two-thirds invested in workforce upskilling (66%), and nearly as many invested in data and digitalisation (64%) during the same period.
Figure 25: Percentage of respondents who have invested in upskilling their workforce, data and digitalisation programs, or workforce diversity over the last 12 months
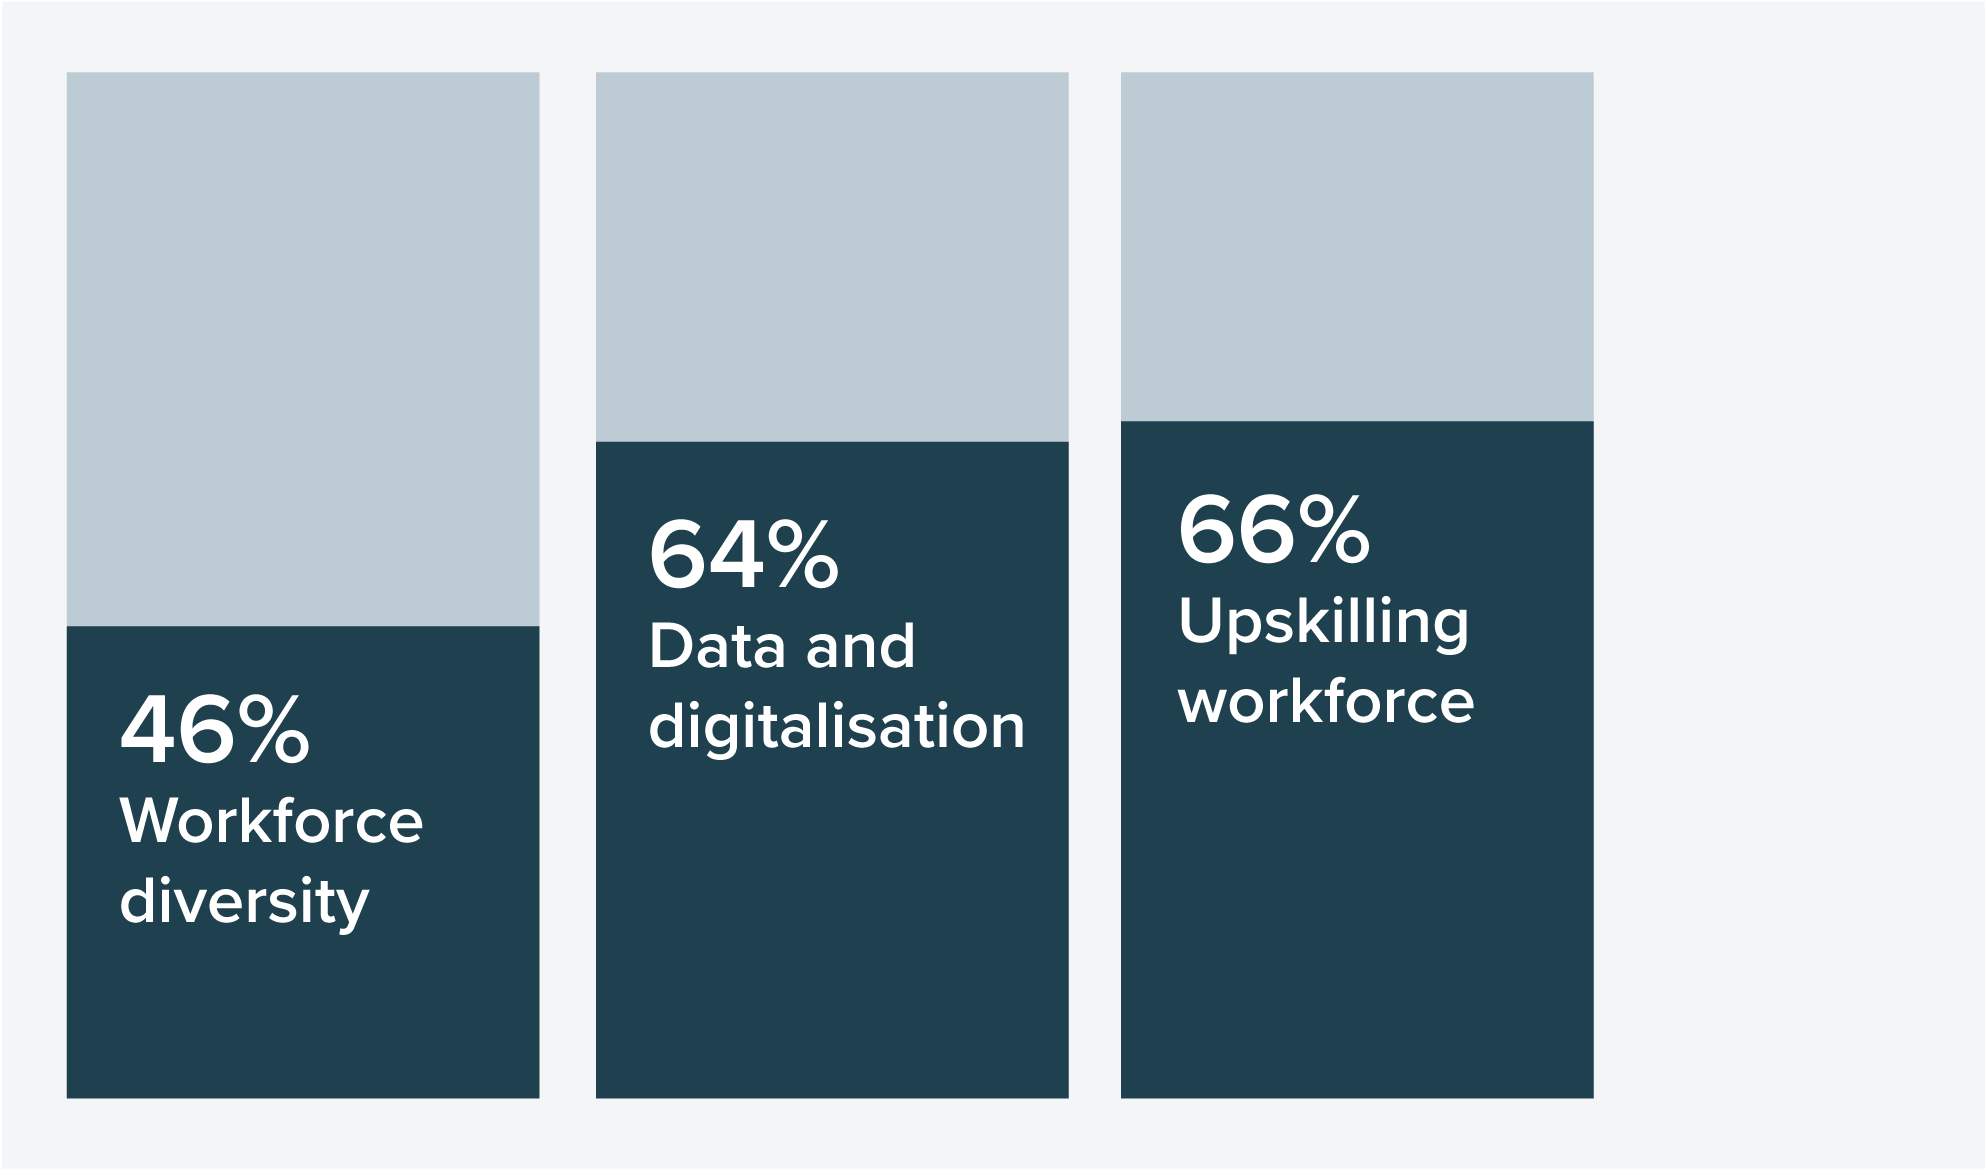
Source: Infrastructure Australia Industry Confidence Survey (2025)
Engineers and designers are more likely to invest (67%) and invest more, with 17% of businesses surveyed investing 11-20% of revenue over the last year. Suppliers are also more proactive than the industry average with 66% having invested in workforce diversity, retention or attraction programs, and 30% investing between 5-10% of revenue.
Meanwhile, 61% of subcontractors did not invest in workforce diversity, retention or attraction programs over the last year.
Of those organisations that have invested in those programs over the last 12 months, close to half (46%) intend to continue to increase investment, while 30% intend to maintain investment, and 12% intend to decrease investment over the next 12 months. Only about 10% of organisations that did not invest this year intend to invest over the next 12months.
Initiatives underway to drive better gender diversity in construction
There is broad recognition of the need to increase women’s participation in construction, and a range of initiatives are in place across industry and governments to drive change.
Under the Federation Funding Agreement Schedule (FFAS) on Land Transport Infrastructure Projects, all governments have committed to optimise their procurement practices to enable an increase in women’s participation at all levels of the construction industry.
Governments are also working on the development of a National Construction Strategy, which includes a workforce workstream that will aim to develop a common set of principles, commitments, and actions to improve workplace culture, enable flexibility, and increase diversity.
It will consider options such as encouraging innovative ideas and best practice, sharing workforce data and lessons, and implementing specific measures such as adopting the Culture Standard (see case study below), enabling flexible work practices like five-day work weeks, and establishing national diversity targets. By embedding these actions into project delivery, the strategy aims to attract and retain a more diverse workforce, reduce turnover, and ultimately improve productivity and sustainability across the sector.
In addition to developing national procurement approaches to boost women’s participation, other entities are working to drive bottoms up cultural change from within, such as the Level the Site project (see case study below).
CASE STUDY
Level the Site – a mentoring program to drive cultural change from within
Level the Site is a joint initiative of the Civil Contractors Federation, Master Builders Australia, the Australian Workers’ Union, Bunnings, and Brickworks. Funded by the Australian Government, the initiative aims to address one of the most pressing challenges in construction retaining women in the workforce.
Industry surveys show that retention is widely recognised as a problem across the sector, with workplace culture consistently identified as a contributing factor. Many in the industry acknowledge that behaviours on site can discourage participation, particularly for women, and that these issues are more likely to be observed by female workers than their male counterparts.
There is strong support across the workforce for practical help to change negative attitudes and drive cultural change that is led internally from within workplaces by employers, managers, and peers.
While regulation can play a role, lasting progress will not be achieved by compliance measures alone. Industry participants themselves say that the most important shifts are attitudinal: equal treatment, less harassment and disrespect, and stronger workplace cultures where women feel supported and valued.
Level the Site is designed to meet that need and aims to build momentum for cultural reform from the ground up. The program delivers:
- Targeted sessions and resources to help employers and supervisors build safe, respectful and inclusive workplaces.
- Mobile trade stalls to showcase construction as a career and highlight opportunities for women.
- Structured peer support and mentoring guidance that connects women with experienced industry role models.
- Social and networking events for women to share experiences and strengthen connections.
- Tool kit talks to give crews the language, awareness, and tools to address workplace culture issues directly.
- An advertising campaign to the broader construction industry communicating the aims of the initiative
The program will be run for three years (2025 to 2028) and support 300 active mentoring partnerships.
CASE STUDY
Pilots of the Culture Standard of the construction industry complete42,43,44,45,46,47
The Construction Industry Culture Taskforce (CICT) developed the Culture Standard to address three major issues in construction: long working hours, poor mental health and wellbeing, and low gender diversity.
The Culture Standard was piloted on five major government infrastructure projects across NSW and Victoria between late 2022 and 2024. Pilots tested the impacts of measures such as capped working hours (≤50 hours/week); five-day work programs instead of six-day rosters; wellbeing initiatives (mental health first aid, flexible scheduling); and diversity actions to increase female participation.
Key findings from the pilots on the adoption of the Culture Standard include:
- Most pilot projects successfully moved to a compressed five-day work week, with only a small reduction in average hours. Workers overwhelmingly preferred this arrangement, indicating improved work-life balance and quality of life.
- There was no clear evidence that the Culture Standard increased project costs or extended timelines. Any minor productivity impacts were generally manageable through planning.
- Adoption of the Culture Standard improved mental health and wellbeing for workers, alongside reduced travel costs due to fewer workdays.
- Turnover on pilot projects was 4.4% lower than the wider workforce average. If scaled across NSW and Victoria, this could save $386–$771 million annually in avoided onboarding and training costs.
- The Culture Standard is expected to help retain experienced workers, particularly women, and attract new entrants, addressing skills shortages.
- Injury frequency rates were on average lower on pilot projects compared to industry benchmarks, though results varied.
- Broader rollout could deliver significant social benefits, including improved wellbeing and reduced costs from turnover and absenteeism. Estimated aggregate travel cost savings alone could reach $52 million per year.
The final evaluation report was released in August 2025, marking the end of the pilot phase of the project. A suite of resources (guides, templates, compliance reporting frameworks) has been developed to support adoption by clients and contractors.
So far, the Australian Capital Territory Government has emedded the Culture Standards in its procurement frameworks for infrastructure projects, while New South Wales and Victoria are exploring options to do the same. While the Queensland Government (through the Department of Transport and Main Roads) and agencies in Western Australia (Department of Finance and Construction Training Fund) have been involved at various stages of the Taskforce as observers.
At the national level, the National Construction Industry Forum (NCIF) has recommended exploring opportunities to implement the Culture Standard nationally (Blueprint for the Future recommendation 4.5) signalling consensus between workers, employers and the Australian Government on broader national adoption of the Culture Standard.
Uptake of new technologies and modern methods of construction
Most organisations have invested in digital transformation and will continue to do so
Results from Infrastructure Australia’s Industry Survey this year reveals almost two out of three organisations in the building and construction industry (64%) have invested in data and digitalisation over the last 12 months. Approximately 35% spent up to 5% of revenue and one in five (22%) invested between 5-10% of revenue. See Figure 26.
Insights from the in-depth interviews indicate that these digital investments supported a variety of productivity-enhancing technologies, such as:
- Automation and robotics in manufacturing enhance efficiency and safety and reduce labour costs.
- Data monitoring to track performance and enable predictive maintenance.
- Digital tools for operations, such as apps for order tracking and logistics management.
- Building Information Management (BIM), including 3D modelling and design, to improve project coordination and consistency of information, reduce errors and improve communication.
- Artificial Intelligence (AI) and machine learning, such as apps for simple on-site queries, real-time quality checks in manufacturing, and investments in enterprise AI systems integrated with company data.
Figure 26: Percentage of revenue invested in data/digitalisation programs over the last 12 months (%)
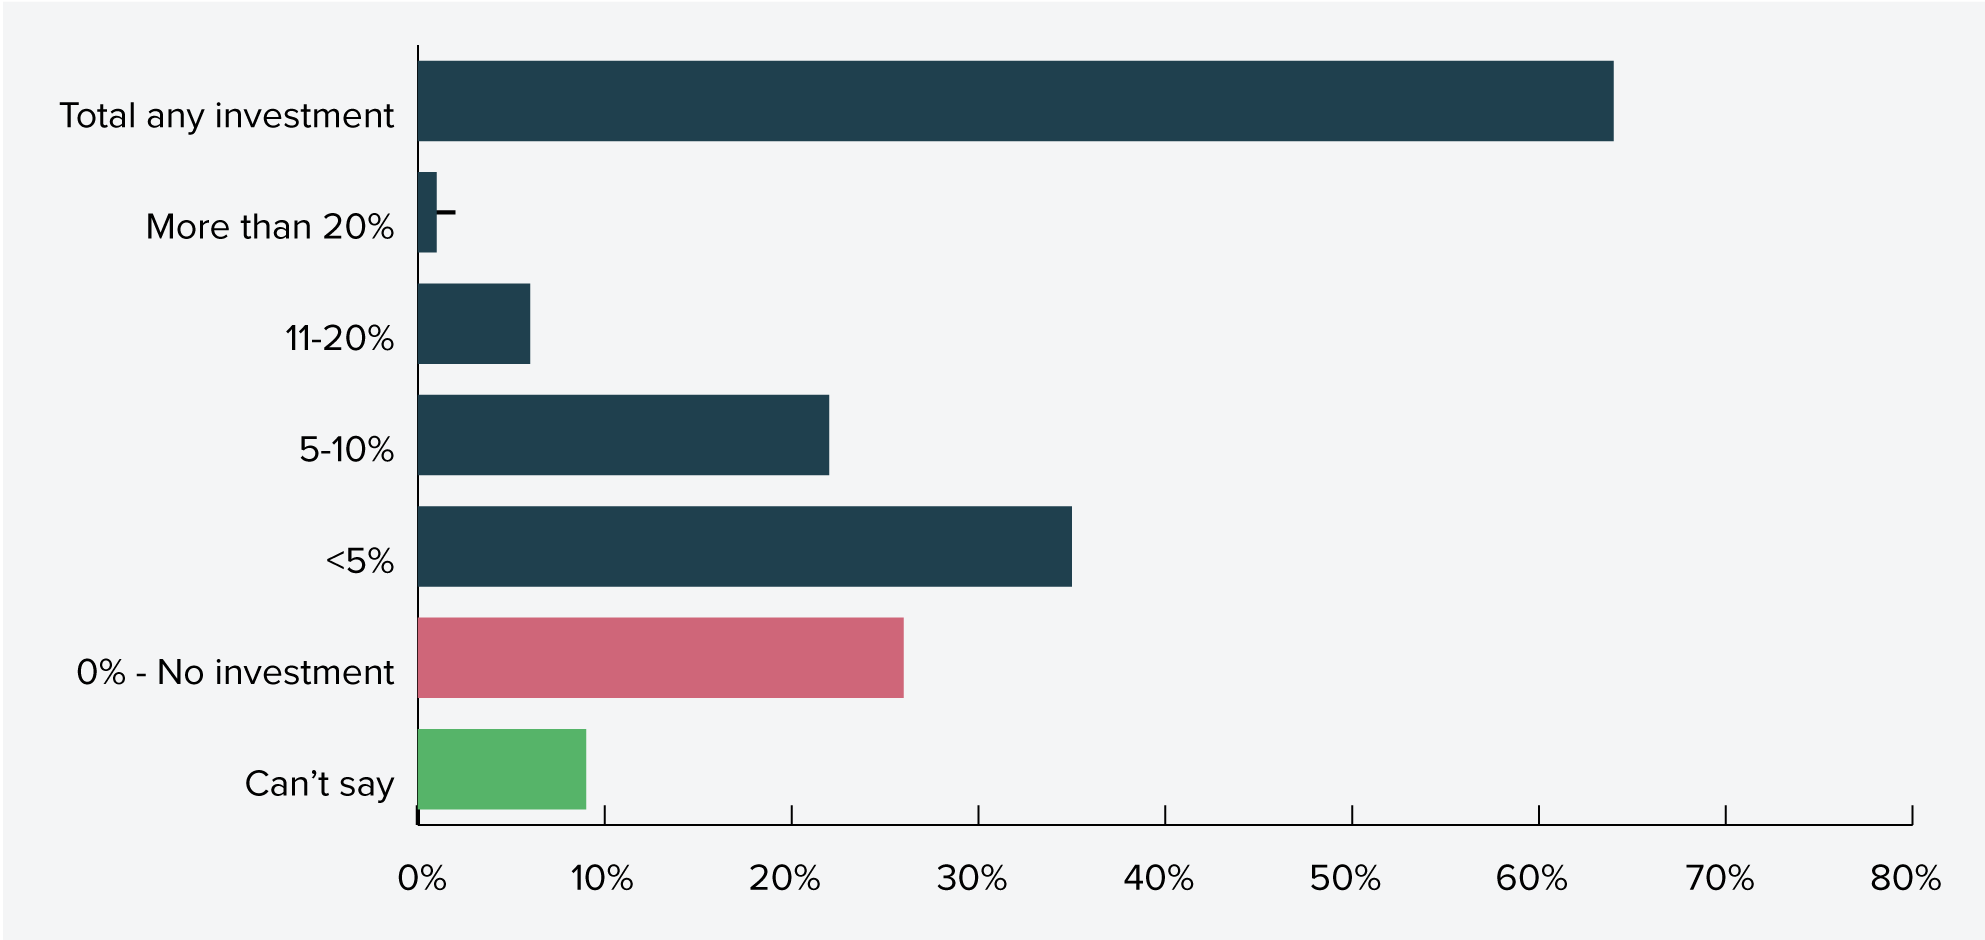
Source: Infrastructure Australia Industry Confidence Survey (2025)
Digital maturity in the industry is growing, led by engineers and designers
Global benchmarks indicate that firms in the growth stage typically allocate around 3–5% of revenue to innovation and R&D for initiatives like integrating data into decision making and automation. Leading innovators often invest 7–10% or more to maintain a competitive edge, particularly in areas such as advanced analytics, AI, and digital-first business models.
Applying these benchmarks to this year’s Industry Confidence Survey, approximately a third of building and construction firms (spending up to 5% of revenue on data and digitalisation) are entering the growth stage of adopting digital technologies and another 29% (spending over 5% of revenue on data and digitalisation) are progressing towards digital maturity.
Encouragingly, of the organisations that have invested in data and digitalisation over the last 12 months, almost three quarters intend to either maintain (49%) or increase (25%) their investment over the next year.
Organisations with engineering and design roles are leading the pack, with 85% investing over the last 12 months and 41% intending to increase investment in the coming year. These firms demonstrate a growing emphasis on data-driven decision-making and the integration of data scientists into traditionally engineering-focused teams.
Soundings
Soundings from industry on investments in innovation and new tech in the last 12 months:
“Introduction of robotics … essentially an automatic tagging machine which replaces labour but improves accuracy, safety … also invested in data monitoring through the mills … traceability in terms of understanding mill performance.” (Supplier)
“The biggest cohort of new hires that they’ve had have been data scientists … looking at how they make decisions, seeing if they can make decisions faster, seeing if they can do more with the trends that are in front of them and challenging some of their assumptions” (Industry)
“They put forward an information model; it provides a 3D diagram of the infrastructure that’s being built … rather than thousands of documents that are needed … and then through the life of the project, it also means that there’s a consistent source of information that has all that data.” (Supplier)
“That’s reliant on businesses being profitable … it is very hard to justify investing in your business in automation. But automation is the key to productivity and there has been a lot of investment … of robotics installed.” (Industry)
A quarter of the industry are yet to invest, representing over a third of small and medium businesses
While most building and construction organisations have invested in data and digitalisation in the last 12 months, a quarter (26%) did not. Of the organisations that did not invest this year, only 9% plan to start investing in the next 12 months.
Smaller organisations are far less likely to invest, as shown in Figure 27. Of organisations surveyed this year by Infrastructure Australia, smaller firms (whose largest current project had a capital value of less than $10 million) were most likely to have made no investment in data or digitalisation over the last 12 months (37%) with this cohort representing 89% of those that did not invest. By contrast, construction organisations with higher value projects were far more likely to invest. Only 11% of firms whose largest project was $10-100 million did not invest and this fell to just 4% for firms with projects valued at $101 million or more.
Figure 27: Percentage of revenue invested in data/digitalisation programs by construction organisations over the last 12 months, by current largest value of project
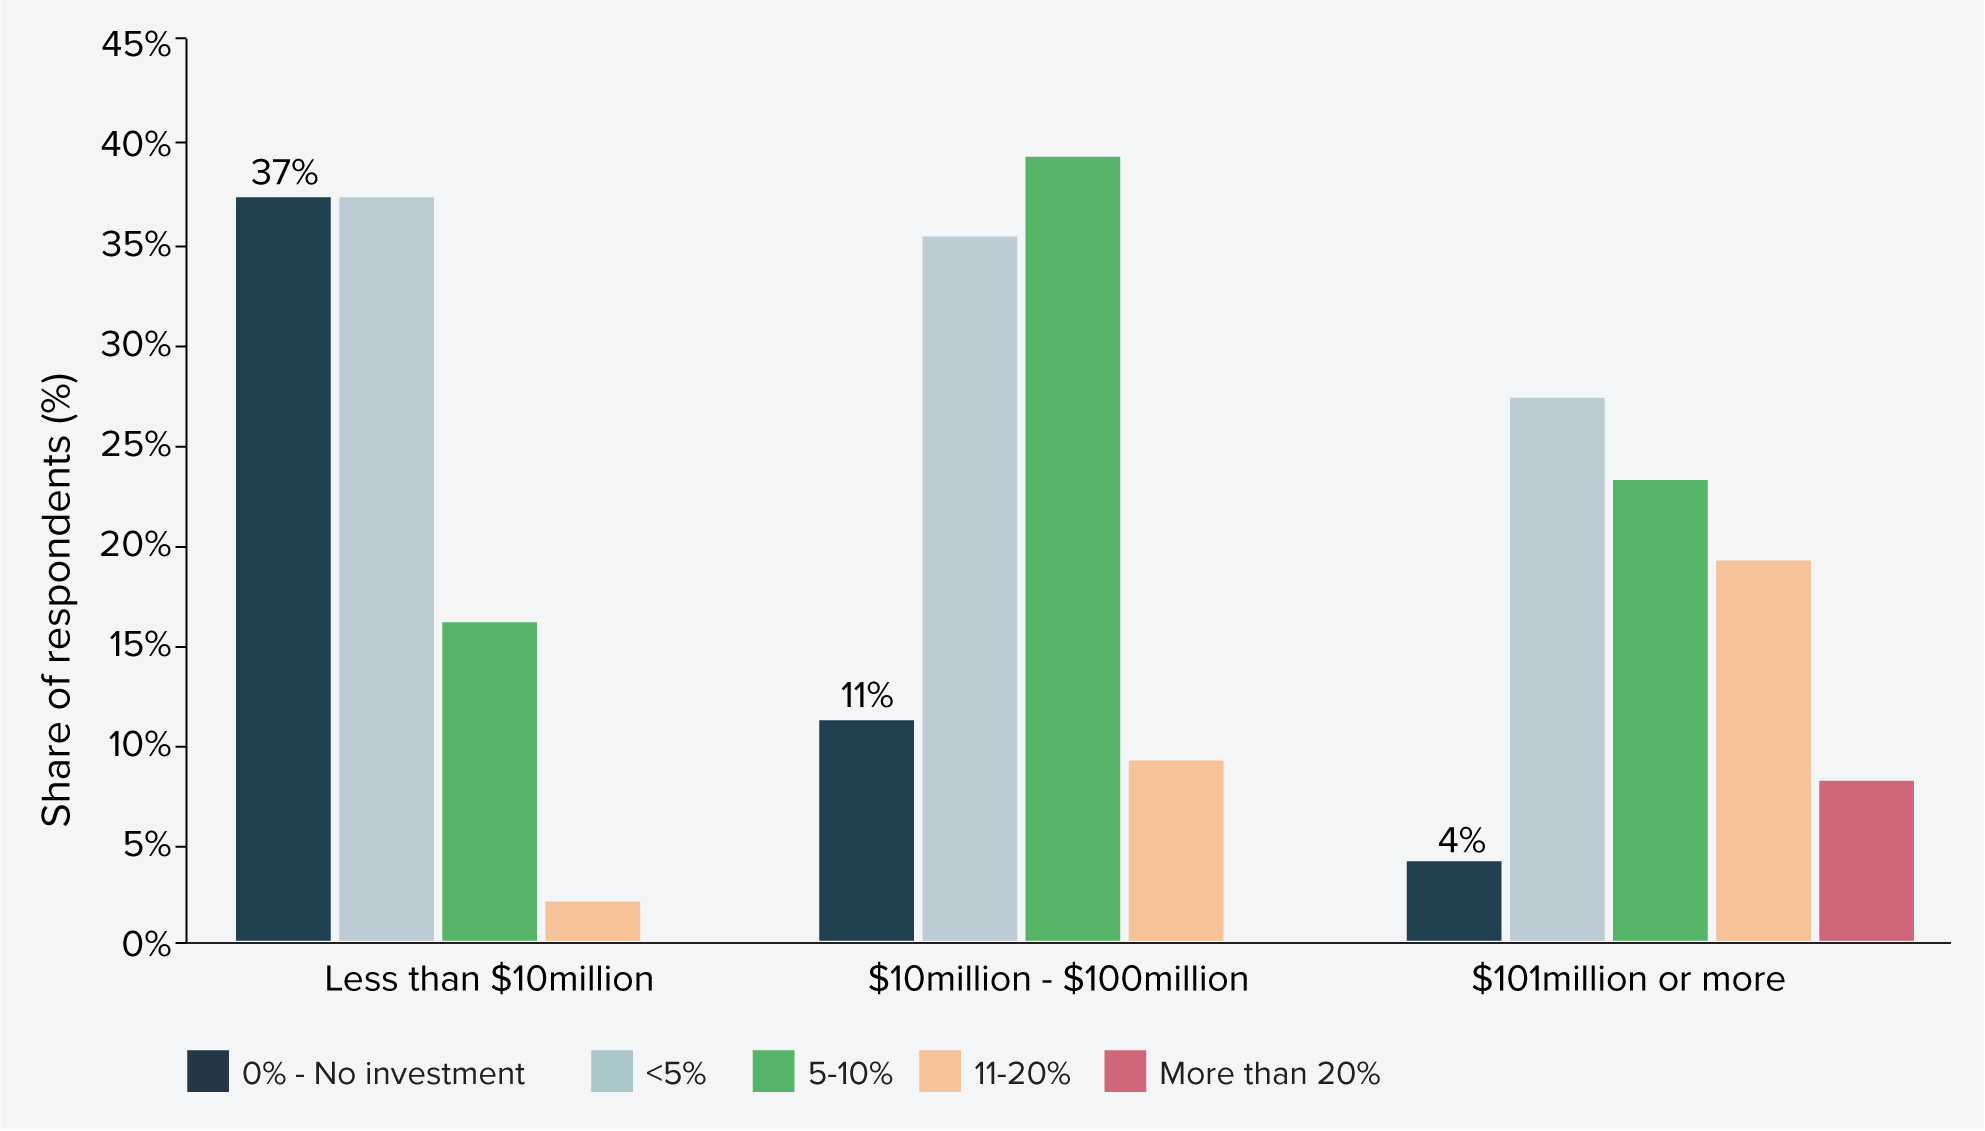
Source: Infrastructure Australia Industry Confidence Survey (2025)
These survey findings are consistent with the National Artificial Intelligence Centre data for small and medium sized businesses (SMEs), which shows 14.3% of construction SMEs use AI, compared to 19.8% across all sectors, as shown in Figure 28. Awareness is also lower – about a third (32.5%) of construction SMEs have no knowledge of AI, versus 22.3% across all sectors.49
Construction industry SMEs based in metropolitan areas (15%) were slightly more likely to be using AI than those in regional Australia (11%), although more significant differences exist between construction firms based on business size.
Figure 28: AI adoption by small and medium enterprises, all sectors and construction sector
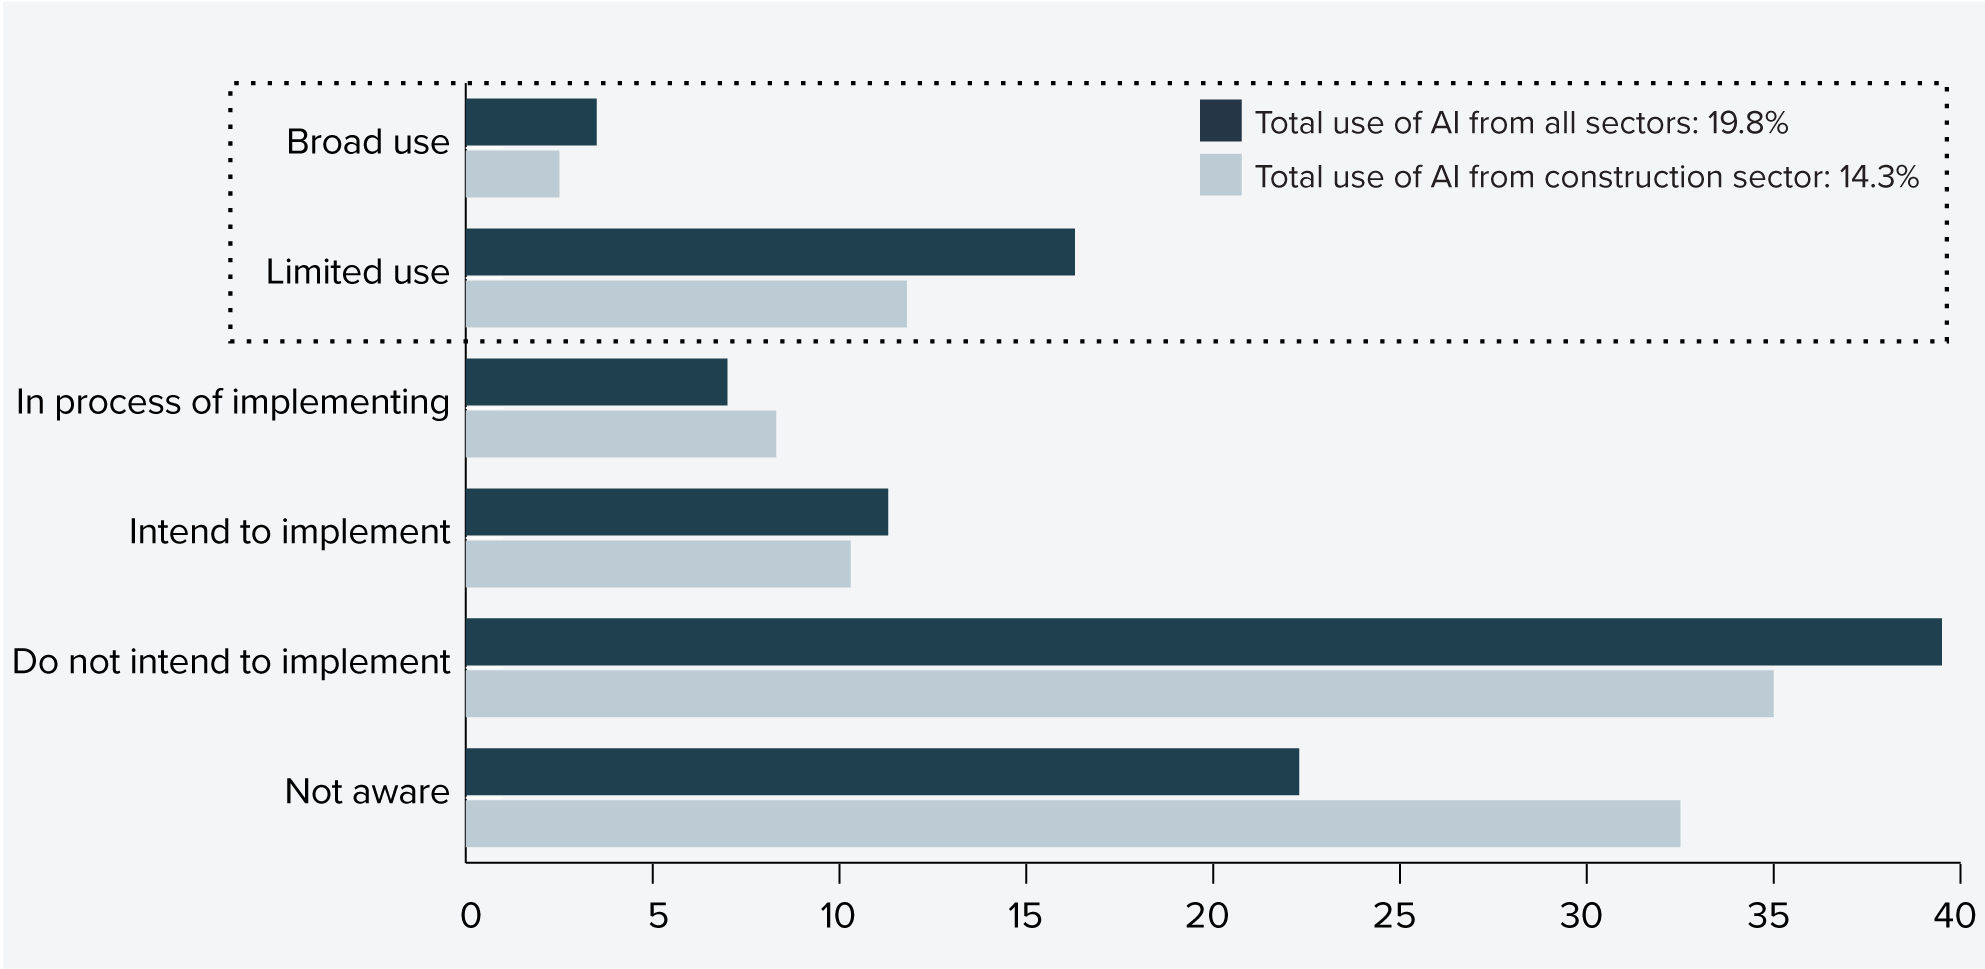
Source: Infrastructure Australia analysis of National Artificial Intelligence Centre AI Adoption tracker data.50
Notes: Data represents average of monthly survey data across 2024 and 2025 year-to-date.
The same data shows about a third (32%) of medium-sized construction firms are not planning to implement or are not aware of AI. This rises to over half (59%) for small construction SMEs, with a quarter (25%) of these firms not aware of AI, as shown in Figure 29.
Figure 29: Artificial Intelligence adoption by construction sector small and medium sized businesses, by organisation size
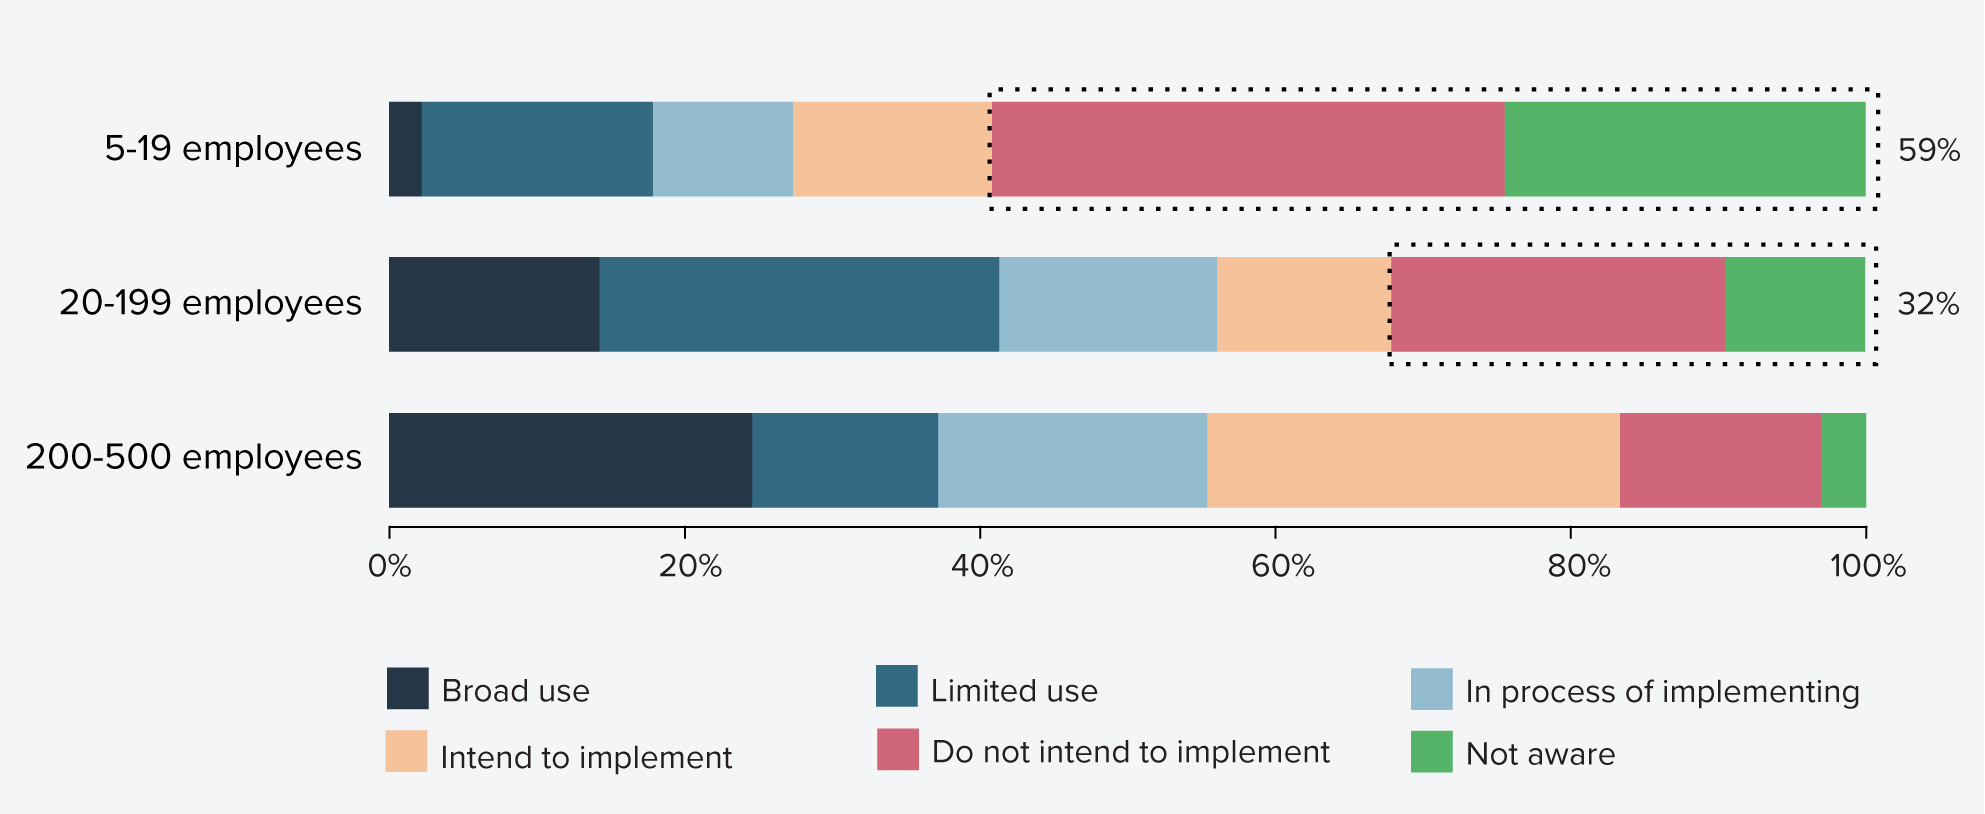
Source: Infrastructure Australia analysis of National Artificial Intelligence Centre AI Adoption tracker data.51
Notes: Data represents average of monthly survey data across 2024 and 2025 year-to-date.
Industry stakeholders interviewed by Infrastructure Australia reported cost as a key barrier to investment in digitalisation, especially for smaller operators. Industry feedback also cited current economic conditions as a hindrance to investment in the last 12 months. Some noted digital transformation is also more challenging where clients continue to rely on paper-based designs and manual processes, or in manual trades where digital tools are seen as less relevant.
Housing is a major motivator and opportunity to drive modern methods of construction adoption
While there is a clear need to, scale-up the capacity and adoption for modern methods of construction, uptake rates of these construction techniques remain low in Australia.
“There has been limited market uptake of modern construction methods, including prefabrication of dwellings or components, due to scale limits.”
National Housing Supply and Affordability Council, State of the Housing System 2025 report52
However, there are signs of increasing adoption and efforts to scale up. The housing supply and affordability crisis is emerging as a prominent driver for action and one of the most significant opportunities to employ modern methods of construction to increase productivity, reduce costs and speed up delivery. This is evidenced by recent progress being made by state governments, with two examples showcased below.
State governments are increasingly looking for modern methods of construction to accelerate new housing
The Queensland Government’s Modern Methods of Construction program is paving the way for faster, smarter, and more sustainable building solutions in Queensland. Led by QBuild, the Queensland Government’s builder and the Office of the Queensland Government Architect, the program addresses the growing demand for housing across the state.
Key Achievements
Since launching in 2022, Queensland’s Modern Methods of Construction program has completed or commenced over 800 homes across the state, with an initial focus on single storey, volumetric modular construction solutions, largely manufactured off-site, transported to their final location and assembled with minimal disruption.
One of the standout projects of the program is the recently completed Bundaberg social housing development. This project comprises six single-storey (class 1) homes built by QBuild in their Rapid Accommodation and Apprenticeship Centre in Zillmere, and six two-storey apartment style (class 2) homes designed, manufactured, and completed by Hutchinson Builders – a tier-1 contractor with Cox Architecture
The Bundaberg project, for instance, was completed in only seven months (post letter of award and including schematic design and construction documentation). It is a precursor of a broader pipeline of more than 200 two and three-storey ‘missing middle’ style dwellings currently under construction.
Lessons learned
The program has demonstrated significant benefits to speeding up delivery and avoiding delays common to traditional construction, such as design revisions or supply chain disruptions.
By using standardised designs and engaging the principal contractor early, the program has reduced project delivery time to around twelve months, including pre-tender feasibility, due diligence, preliminary design and approval processes.
The partnership with the same principal contractor and their design consultant throughout has also fostered innovation and collaboration while reducing the downtime often associated with single phase commissioning.
Next step to scaling wider modern methods of construction adoption
As the program is integrated into the state’s capital delivery pipeline there is an opportunity to further develop agnostic design, contracting and procurement processes. These processes need to value the faster, smarter, and sustainability benefits of modern methods of construction while also allowing the market to determine the best construction methodology and value for money solution to address different housing needs. These needs include the delivery of higher density four to six-storey social and affordable housing projects across the state.
Lessons learnt from the program will also inform the development of a whole of Government modern methods of construction action plan to assist in the delivery of not only housing, but other key government sectors, such as education, health, corrections and the 2032 Olympics.
The NSW Government has made modern methods of construction a strategic priority to boost domestic manufacturing and productivity, enabling faster housing and infrastructure delivery. These commitments are reflected in the NSW Government’s Principles for Partnership with the Construction Sector and Industry Policy.
There are a range of barriers to increasing uptake of modern methods of construction including: pipeline uncertainty, preferences for bespoke design, insufficient industry incentives, unclear planning and regulatory requirements, and knowledge and skills gaps.
Action is underway to overcome these barriers, such as the introduction of modern methods of construction pattern books, updating procurement processes, improving supply chain transparency, revising regulatory settings, providing targeted funding, and delivering capability and skills uplift programs.
NSW Government agencies are already using modern methods of construction in project delivery:
- Landcom is delivering nine two-storey terrace homes in Schofields as a test case for future modern methods of construction housing projects.
- NSW Department of Education is using modern methods of construction to rebuild nine schools impacted by the 2022 floods.
- Homes NSW aims to delivery approximately 13 secondary dwelling demonstration projects using modern methods of construction and volumetric construction in 2025/2026, and a further 80 dual occupancies using a range of modern methods of construction methods in 2026/2027.
- Homes NSW, in partnership with Building 4.0 CRC, is developing a kit-of-parts 2-bedroom apartment prototype and leading program implementation, measurement and evaluation.
The NSW Construction Leadership Group (CLG) coordinates infrastructure planning, procurement, and delivery across the NSW Government. The CLG has established a Modern Methods of Construction Working Group to align NSW Government activities, share lessons, and address systemic barriers to modern methods of construction uptake.
National level initiatives will address regulatory barriers to widen modern methods of construction uptake
Regulatory barriers create challenges for industry to scale up modern methods of construction capacity and propose alternative modern methods of construction delivery options that are equally competitive with conventional construction methods. These regulatory barriers include a lack of design standardisation, which may also create challenges integrating offsite-manufactured components and on-site assembly with traditional construction methods. There remains a need for consistent methods and tools for quality assessment and accreditation. Building codes and operator licensing regulations must also adapt to support standardisation, compliance and competitiveness and enable suppliers to operate across borders.
The Australian Government, in partnership with state and territory governments, will address some of these regulatory barriers through the National Competition Policy reforms.
The National Competition Policy reforms will address barriers to adoption
The National Competition Policy (NCP) reforms will play a pivotal role in increasing the national adoption of modern methods of construction by removing regulatory barriers and incentivising innovation across jurisdictions. Under a ten-year reform program signed in late 2024, the Commonwealth and state governments agreed to modernise competition principles and undertake productivity-enhancing reform, including amending regulatory frameworks that currently favour traditional, onsite construction.53
These initiatives will be complemented by other reforms being progressed through NCP including improved adoption of standards and the development of a national licensing scheme for electrical tradespeople.
Backed by the $900 million National Productivity Fund, these reforms are expected to unlock significant economic benefits, with the Productivity Commission estimating up to $6 billion in GDP gains through faster, lower-cost housing delivery and improved construction productivity.54
In addition to the National Competition Policy reforms, other recent national initiatives announced supporting modern methods of construction include: the Australian Government working with states and territories and stakeholders to streamline the National Construction Code, including removing barriers to the uptake of modern methods of construction,55 additional funding ($49.3 million) to states and territories to boost adoption,56 and development of a voluntary certification scheme to streamline regulatory approvals.57
On the demand side - a clearer pipeline and upfront incentives can scale up innovations, including modern methods of construction, from market-ready to market-wide solutions
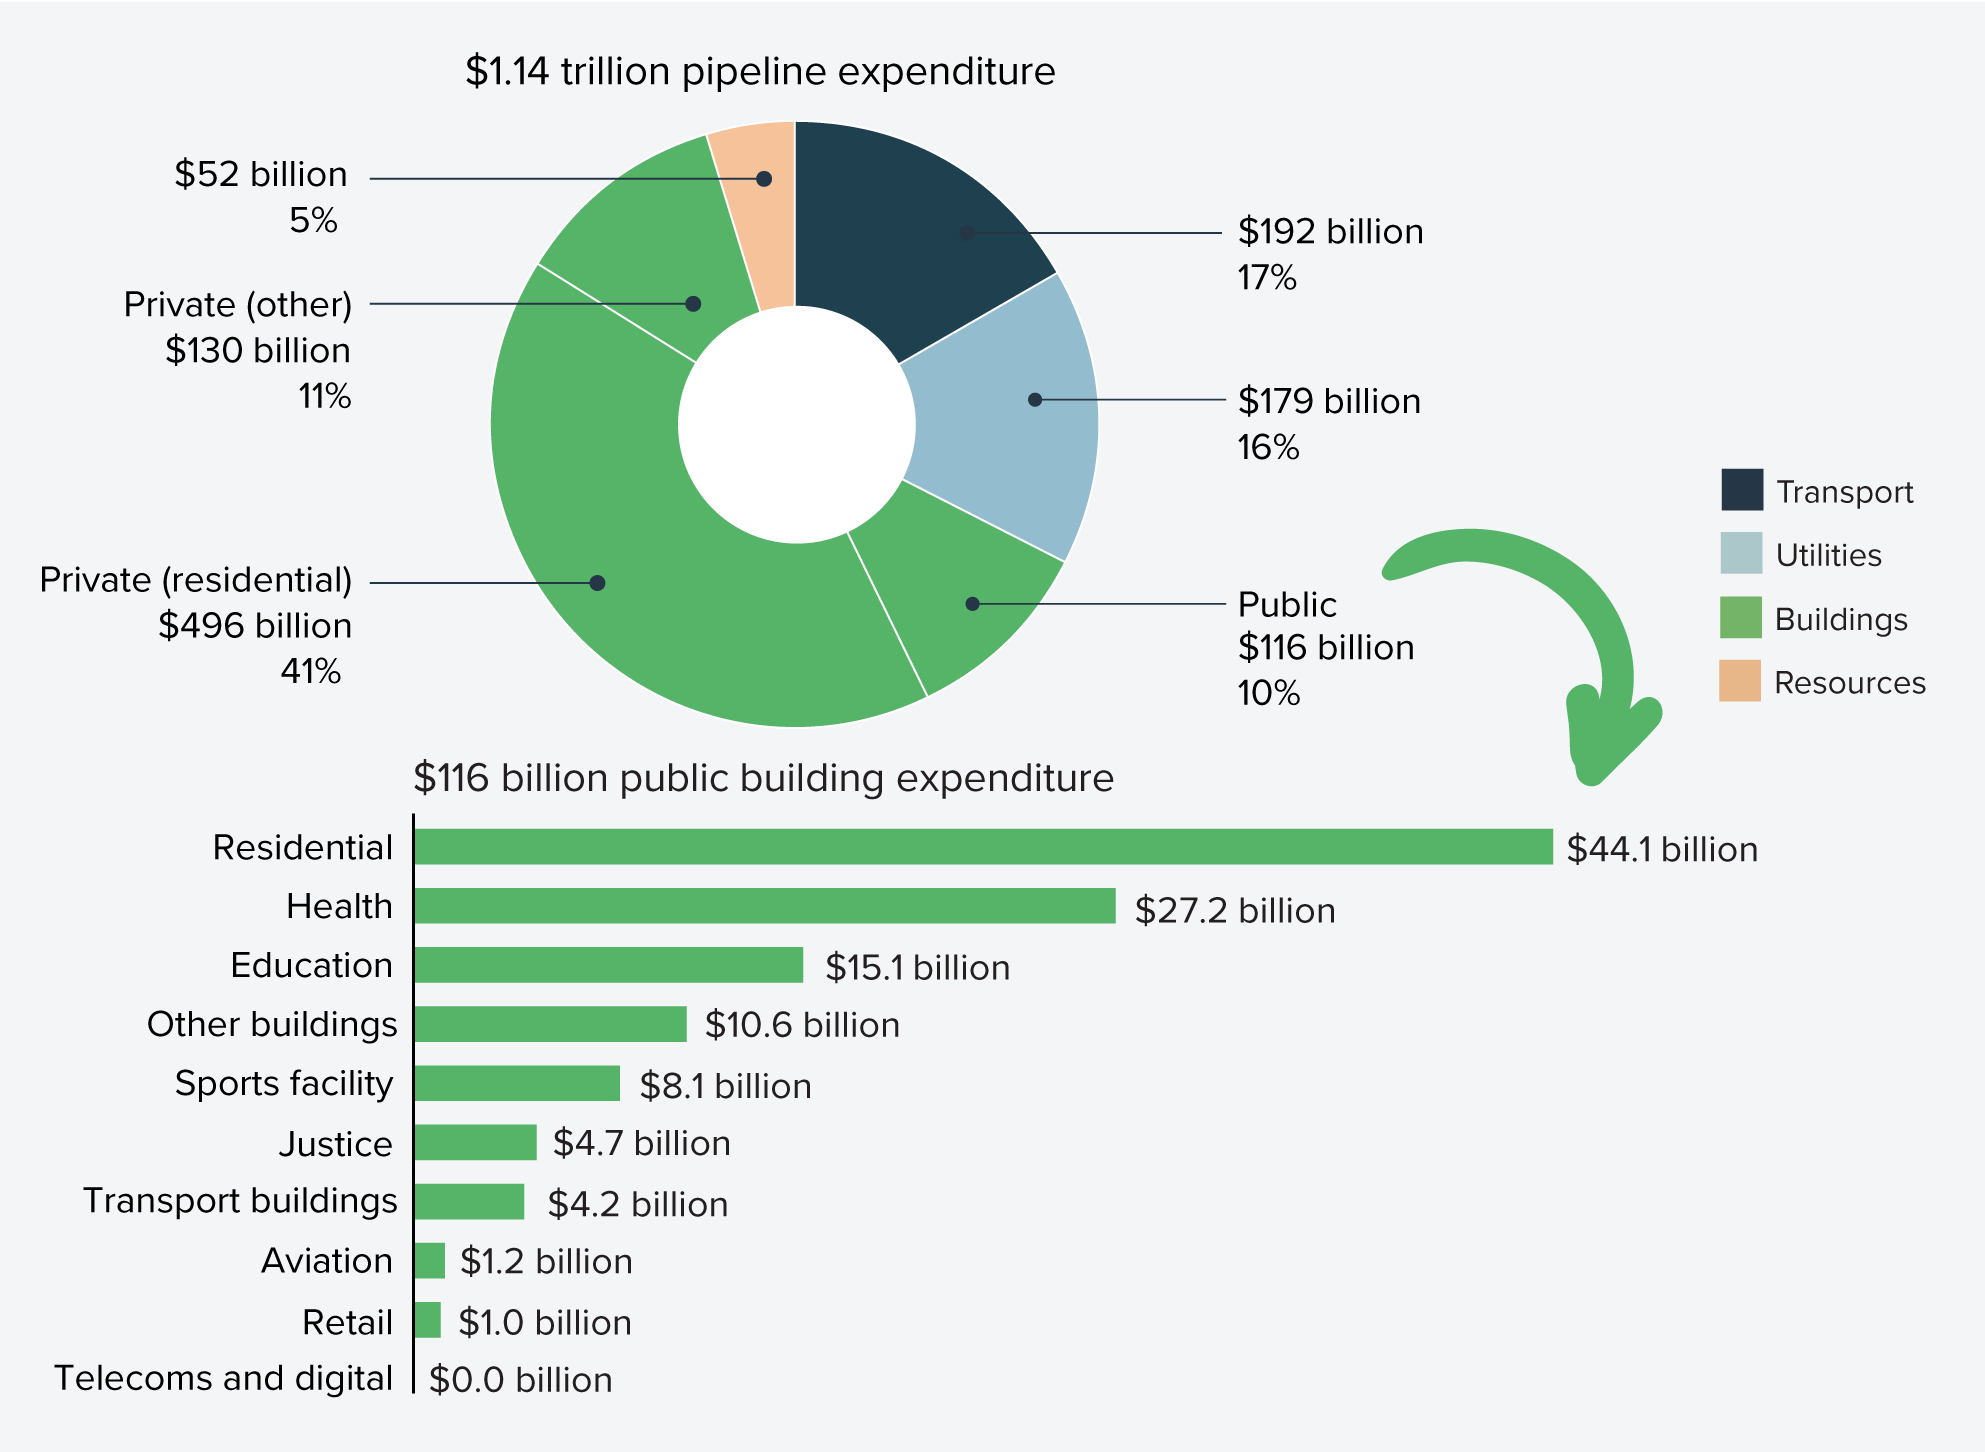
While states and territories are actively embedding more modern methods of construction approaches in their own jurisdictions, demand remains fragmented and often limited to individual projects or programs. Governments have collectively invested $44 billion in social and affordable housing, $27 billion in health buildings such as hospitals, and $15 billion in education buildings over the five-year outlook (2024-2025 to 2028-2029). These are all project types with high application potential for modern methods of construction. Further, modern methods of construction approaches have yielded at scale productivity improvements for the transport infrastructure sector such as bridge, rail and metro projects.
While Infrastructure Australia’s Industry Confidence Survey signals growing momentum in investment in digitalisation – particularly among firms in engineering and design – uptake across the broader infrastructure sector remains uneven. Adoption of modern methods of construction and other transformative innovations continues to lag, constrained by entrenched delivery models, fragmented procurement practices, and limited incentives for risk-sharing.
High upfront investment costs and uncertainty around modern methods of construction pipelines can deter industry from scaling modern methods of construction capacity. A more coordinated approach –aggregating projects into strategic pipelines by type – could provide the certainty needed to unlock investment and build capability.
Government clients and industry contractors can often be reluctant to look at innovative ideas and approaches on infrastructure projects, where the focus is often on minimising risks and sticking to standardised methods and technologies. For innovation to succeed, new solutions that can realise productivity gains need to be developed, proven and scaled. Doing so requires systematic approaches designed in a collaborative way by governments and industry.
‘Innovation hub’ models are an important piece of the puzzle for attracting co-investment in research, development and piloting of new technologies and overcoming the ‘valley of death’ between concept and commercialisation. Examples include Australia’s Cooperative Research Centres (CRCs) and the UK’s Catapult Centres. These are vital for taking novel ideas and nurturing them into market-ready products and services. However, they do not address the critical next step of driving uptake and integration of now proven, commercialised but still novel solutions into wider practice.
Where doing so offers clear public benefits, government support can help stimulate markets for demand and build the capacity and scale required to create the supply for proven innovations. In the construction context, a key role for governments is to harness the enormous capital investments made in public infrastructure to drive adoption of innovations that can contribute long-term benefits to productivity across the sector. This means finding structured ways (through levers such as funding, procurement and collaboration) to leverage large-scale infrastructure projects and programs as platforms to support investment in and deployment of innovative solutions, which can simultaneously stimulate demand, help build capacity and skills in government and industry, and demonstrate tangible benefits.
Overseas experience shows that alternative co-investment models between government and industry – at the individual project, infrastructure sector or industry-wide scale – can accelerate the uptake of proven but under-used technologies and scale industry capacity and adoption to deliver step changes in productivity and sustainability. Examples from the United Kingdom, Singapore, and the United States are provided below.
United Kingdom: Crossrail Project Innovation Strategy58,59,60,61,62,63,64,65,66,67
Crossrail was a transformational $30 billion rail project to construct the Elizabeth Line through central London from Reading and Heathrow in the west through to Shenfield and Abbey Wood in the east. The project aimed to increase London’s rail capacity by 10% to carry 200 million passengers a year, reduce journey times and improve access, including bringing 1.5 million more people to within a 45-minute journey of the city centre. At its peak, Crossrail involved 75 companies and 10,000 people directly supporting delivery.
In early stages of the project, isolated pockets of innovation were taking place across different suppliers in response to specific challenges and opportunities arising in delivery. While positive, this activity lacked strategic direction, sponsorship, coordination and access to funds. Crossrail established an innovation strategy to provide a systematic way of mobilising and managing innovation during construction. This defined a set of specific challenges as a focus for innovation and – through leadership, governance and engagement – drove a cultural shift towards collaboration across different government department, industry supply chain and on-site delivery organisations.
The strategy encouraged construction firms in the project supply chain to develop innovative products and processes, apply them to the project itself and ensure they were shared. Measures included establishing new key performance indicators in existing contractual incentives, streamlining change management processes and tracking innovation activity and conversion rate of ideas into implementation.
A dedicated innovation program fund (Innovate18) was also developed by inviting tier 1 suppliers to commit to small funding contributions matched by public funds, used to seed-fund new ideas to a stage of demonstrating value and ability to deploy at scale. This fund, supported by a collaborative executive-level steering group, innovation working group, and small program team, promoted a collective approach to investing in and developing innovative solutions.
The fund invested over $665,000 in innovation projects. In the first 12 months, over 400 ideas were submitted with 180 developed into innovative solutions. Benefits were evaluated at between $5 million to $10 million as well as additional intangible benefits in areas such as health and safety and innovation culture. Overall, the adoption of innovations developed through the program demonstrated clear benefits to industry suppliers including increased efficiencies, accelerated delivery schedule, improved environmental performance and reduced health and safety hazards.
Over 100 shared innovations developed out of Crossrail were carried forward to future infrastructure projects, demonstrating how structured innovation strategies can drive systemic change across the construction sector. Examples include:
- Advanced Building Information Modelling (BIM) for integrated design and asset management, which set the benchmark for the UK Government’s BIM Level 2 mandate.
- The Innovate18 platform fostered collaborative idea-sharing and evolved into the industry-wide i3P network.
- Technical innovations such as sprayed concrete lining (SCL) improved tunnelling efficiency and are now widely used in underground works.
- The introduction of digital safety tools for real-time monitoring and compliance, and advanced offsite manufacturing and modularisation, reducing on-site risks and improving delivery speed.
Singapore: Productivity Innovation Project Incentive Scheme68,69,70
Singapore’s construction sector historically relied on low‑skilled foreign labour, resulting in low productivity, rising costs, and inefficiencies. With ambitious housing and infrastructure needs, the government recognised that without action to increase productivity, including accelerating adoption of modern methods of construction and digital tools, industry would struggle to modernise and meet demand sustainably.
Alongside a range of mechanisms to drive modern methods of construction adoption – including to establish Integrated Construction and Prefabrication Hubs and provide structured processes for government procuring entities to integrate modern methods of construction - the government’s Building and Construction Authority (BCA) also introduced the Construction Productivity and Capability Fund (CPCF) to build capability and kick start adoption of innovative solutions in construction that improve productivity.
The CPCF includes several initiatives, including a Building Information Modelling (BIM) Fund and the Productivity Innovation Project (PIP) Incentive Scheme. Launched in 2018, the PIP scheme provides direct government financial assistance to construction firms for innovation projects to de‑risk investments in innovation and accelerate adoption. Grants cover up to 70% of the cost of projects (up to a maximum of $11 million) that develop new capabilities for technology adoption, site process re-engineering and innovation in construction projects and lead to significant site productivity improvement of at least 20%. It primarily supports investments in adoption of productive technologies – such as robotics and automation, integrated digital delivery systems and modern methods of construction.
By 2019, the PIP had helped improve site productivity by 17.6% compared to 2010 levels and meant Singapore was on track to achieve 70% modern methods of construction adoption by 2025 under the government’s Construction Industry Transformation Map. As of 2022, the PIP had funded 78 construction firms to adopt transformative technologies. Examples include a mechanical, electrical and plumbing subcontractor to automate pipe cutting and welding in their off-site factory, resulting in a 40% productivity gain compared to manual processes. Another funding recipient installed an on-site automated drilling and anchoring robot to replace manual processes, increasing productivity by at least 30% as well as improving worker safety. The program was extended to 2025 as part of a further $202 million investment in construction sector innovation programs and incentive schemes.
United States of America: Federal Highway Administration Center for Accelerating Innovation71,72,73,74
The US Federal Highway Administration (FHWA) identified that highway infrastructure projects across the US were often delayed as a result of outdated processes, fragmented coordination, and the slow pace of agencies to adopt proven new technologies, materials and practices, and integrate these into mainstream use. FHWA recognised the need for national mechanisms to accelerate deployment of innovative solutions that could improve productivity and safety and reduce costs.
The FHWA launched several initiatives designed to accelerate innovation in response to inefficiencies in highway project construction, including the Highways for LIFE (HfL) and the Every Day Counts (EDC) programs. Since these programs were created, the FHWA Center for Accelerating Innovation was established in 2012 to build on these programs and provide a focal point for strategic innovation deployment across the country.
HfL was set up in 2005 to create a technology deployment process and offer funding incentives for state and local highway agencies to speed up the use of innovative approaches on highway and bridge construction projects, and more effectively move them into widespread adoption.
Between 2006 and 2014 the program provided over $85 million in funding support for 60 innovation projects across 37 states, supporting the adoption of innovations including accelerated bridge construction techniques, high-performance materials, prefabricated bridge components, precast concrete pavement systems and new approaches to contracting.
One project in Massachusetts involved replacing 14 aging bridge superstructures on Interstate 93 using prefabricated bridge sections constructed off-site, and accelerated construction techniques. The project reduced construction time from 48 to 9 months, substantially reduced the traffic impacts of construction to 550 hours and resulted in a 2% cost saving compared to conventional construction.
The EDC program provides a collaborative innovation management model that identifies proven but under-used innovations and engages state transport departments, local governments and industry to prioritise opportunities for accelerated deployment in each state. State Transportation Innovation Councils (STICs) then set performance goals for adoption of chosen innovations over a two-year cycle and lead implementation. The FHWA provides support to states through deployment teams that offer technical assistance, training and engagement to facilitate technology adoption and integration of solutions into standard practice, as well as financial assistance through STIC incentives (up to US$125,000 per year) and Accelerated Innovation Deployment grants of up to US$1 million to support the costs of deploying innovative solutions on highway projects.
Since the EDC program was established, it has so far supported 57 innovative solutions across seven rounds between 2011/12 and 2023/24. Each state has applied at least 26 of these with some using more than 45, and many innovations now embedded in mainstream practice across the US.
EDC has supported several projects to accelerate modern methods of construction deployment, such as the Prefabricated Bridge Elements and Systems project. This supported adoption of bridge components such as pier columns and caps, beams and decks that could be fabricated concurrently offsite and delivered as needed, rather than having to construct different components and build them sequentially on site – reducing build time, improving safety and reducing traffic impacts.