Delivering Net Zero and a Clean Energy Economy
Header description
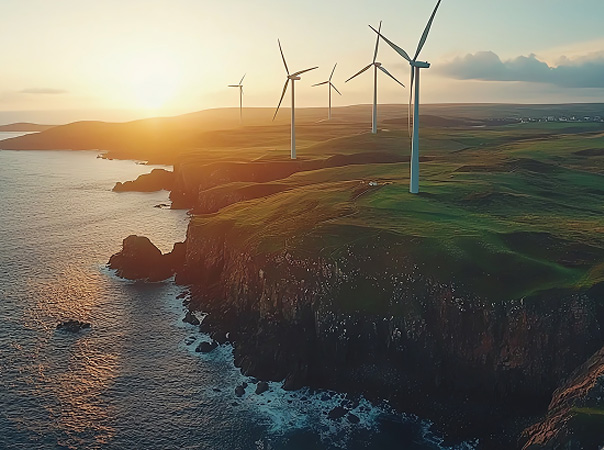
Australia’s transition to net zero will require a rapid scale-up of renewable energy generation, transmission and storage, supported by enabling infrastructure and the decarbonisation of construction and transport.
Decarbonising infrastructure
Delivering infrastructure for economy-wide decarbonisation
Embodied carbon – GHG emissions associated with materials and construction processes over an asset’s life – accounts for a significant and growing share of Australia’s total emissions. As operational emissions decline through grid decarbonisation, embodied emissions are set to become the dominant climate impact of built infrastructure.194
Buildings and infrastructure are directly responsible for nearly one-third of Australia’s total emissions and indirectly responsible for over half. In 2023, embodied carbon contributed 10% of national emissions, with upfront emissions alone accounting for 7% (i.e. emissions up to construction completion).193
Up to 23% of upfront carbon emissions from public infrastructure could be abated by 2027 through practical, like-for-like material substitutions and decarbonisation strategies, equating to a reduction of 9 million tonnes of greenhouse gas emissions – about 2% of Australia’s total annual emissions.193 In addition to like-for-like decarbonisation strategies, further significant emissions reductions would be achievable through design optimisation and build-less strategies.193
Emerging technologies will help infrastructure owners extend the life of existing assets by enabling optimisation of asset use (such as demand management, route planning, autonomous vehicles, coordinated CER etc), repurposing existing infrastructure (such as Origin Energy’s Eraring battery, which leverages the retiring coal plant’s infrastructure and network connections), and retrofitting legacy assets (for instance, converting coal power plants into thermal energy storage batteries).195,196
The majority (75%) of upfront embodied emissions arise from the manufacture of construction materials such as steel and cement, with the remainder from construction processes and transport. Decarbonising infrastructure not only relies on the development of mature supply chains for recycled and green building materials (which itself depends on complex transitions in mining and manufacturing sectors) but also on new technologies and, importantly, incentives to support private sector innovation.
A key step towards infrastructure decarbonisation is the production of low-emission and green steel. Over the next five years, steel for the Major Public Infrastructure Pipelinexxvii,197 will be responsible for about 40 million tonnes of greenhouse gas emissions, equivalent to around 33% of Australia’s total domestic steel manufacturing emissions over the same period.xxviii,198 Technologies such as Electric Arc Furnace and Hydrogen Direct Reduced Iron are needed to produce low-emissions steel, however these require large capital investments by private steelmakers in the face of higher production costs compared to traditional methods. Governments can support private investment by driving uptake of low-emissions steel through infrastructure procurement programs.
South Australia’s Green Iron and Steel Strategy aims to make South Australia a global leader in producing low-emission iron and steel by leveraging its abundant magnetite, renewable energy, and growing hydrogen supply to build new industries, transform existing steelmakers (such as Whyalla Steelworks), and export green iron by 2030.
Other opportunities to reduce embodied emissions in built infrastructure include:
- linking new construction decisions to Net Zero 2035 and 2050 reduction targets
- at the earliest ‘problem identification’ stage of a project, using the decarbonisation hierarchyxxix to drive a clear strategy for reducing whole-life carbon
- applying lifecycle thinking to manage environmental and social impacts, minimise carbon footprints and avoid trade-offs.
Decarbonisation also calls for more flexible and responsive standards and guidelines for procuring and building infrastructure so new technologies can be adopted more easily. Australian jurisdictions are already progressing work in this area, including:
- The Embodied Carbon Measurement for Infrastructure: Technical Guidance which provides a consistent approach for measuring embodied carbon in infrastructure projects nationally by infrastructure delivery agencies, their advisors, delivery partners, and emissions tool vendors. This guidance supports consistency across all Australian jurisdictions by providing common methodology, assumptions and reporting approaches.
- The National Sustainable Procurement in Infrastructure Guideline is designed to support jurisdictions to reduce embodied emissions during procurement through to development and delivery of infrastructure projects. The guideline is targeted at transport agencies, infrastructure bodies, and other public officials responsible for delivering infrastructure and contracting with industry.
Operational and enabled emissions
Operational emissions are the GHG emissions produced during the use of an infrastructure asset after construction is complete and throughout its operational life. These include scope 1 and 2 emissions.xxx Operational emissions from buildings and infrastructure represented about 21% of Australia’s national emissions in 2023.193
The share of operational emissions as a component of infrastructure asset emissions over their lifecycle is expected to decline as Australia’s electricity grid transitions towards renewables and more efficient demand and storage technologies are adopted.
Enabled emissions are GHG emissions that are made possible by the existence of an infrastructure asset but are not directly produced by its construction or operation. For example, emissions from internal combustion vehicles using a motorway, or diesel trains on a rail line. Enabled emissions accounted for 26% of Australia’s national emissions in 2023.193
Enabled emissions can be directly influenced by government investments in and support for electric trains, buses, cars and trucks, for example:
- EV and battery technology adoption, particularly for government fleet vehicles and road and rail freight
- electrification of public transport rolling stock (passenger trains and buses)
- EV charging networks
- active and public transport.
There is an opportunity for high capacity public transport proposals to consider battery-based options for new network investments and rolling stock. For example, South Australia already operates hybrid diesel-electric railcars on Adelaide Metro’s non-electrified Outer Harbor, Grange, Belair and Port Dock lines. Battery, battery-electric or combined battery-diesel-electric railcars could reduce the need to install overhead power lines on rail extensions, potentially reducing the cost of passenger rail extensions while also helping to reduce public transport carbon emissions.
The National Electric Vehicle Strategy supports the increased uptake of EVs through the development of a Fuel Efficiency Standard for light vehicles, and notes existing State and Territory policies such as Queensland, Victoria and New South Wales governments’ aim for 50% of new light vehicles sales to be EV by 2030-31 and for government fleet vehicles to transition to EVs. The Strategy notes that expanding charging infrastructure, particularly along national highways and in remote and regional areas, will support wider EV adoption.
The Australian Government is partnering with the NRMA to install a network of 117 fast chargers on national highways at an average interval of 150 km.199 This will support the use of electric trucks on national freight routes, however, gaps in charging infrastructure for electric trucks may remain on key freight routes off national highways and in remote and regional areas.
Infrastructure Australia has previously listed National highway electric vehicle fast charging on the Infrastructure Priority List, which identifies the opportunity to develop a network of fast-charging stations on the national highway and policies and regulation to support charging technology adoption.
State governments are already progressing initiatives to reduce operational emissions in the freight sector. For example, New South Wales’ Towards Net Zero Emissions Freight Policy and Western Australia’s Sectoral Emissions Reduction Strategy, which specifically call out road freight emissions reduction. The 2026 Infrastructure Priority List includes Victoria’s proposal Enabling infrastructure for zero emissions and high productivity freight vehicles in Victoria, discussed in the High Productivity Freight Networks section.
Electrification of buses is a key near-term action to reduce transport emissions, forming part of the Australian Government’s Transport and Infrastructure Net Zero Road Map and Action Plan.
New South Wales, Victoria, Queensland, South Australia, Western Australia and the Australian Capital Territory have all announced plans for zero-emissions buses, with targets set for purchasing or replacing bus fleets with zero-emission vehicles. With more than 20,000 public buses owned and operated by state and territory governments,200 programs to transition fleets to hybrid and zero emissions buses will be significant and take many years to deliver. This creates opportunities for cross-jurisdictional collaboration on procurement, fleet rollout, and depot infrastructure upgrades.
Current procurement timelines (refer Figure 7) demonstrate that New South Wales makes up 67% of the forward pipeline of Zero Emissions Bus (ZEB) purchases, followed by Victoria (18%) and Queensland (11%). However, the pipeline will continue to grow, noting that current ZEB procurements cover just 21% of the existing public bus fleet.
Figure 7 – Planned or forecast Zero Emissions Bus procurements by year and jurisdiction
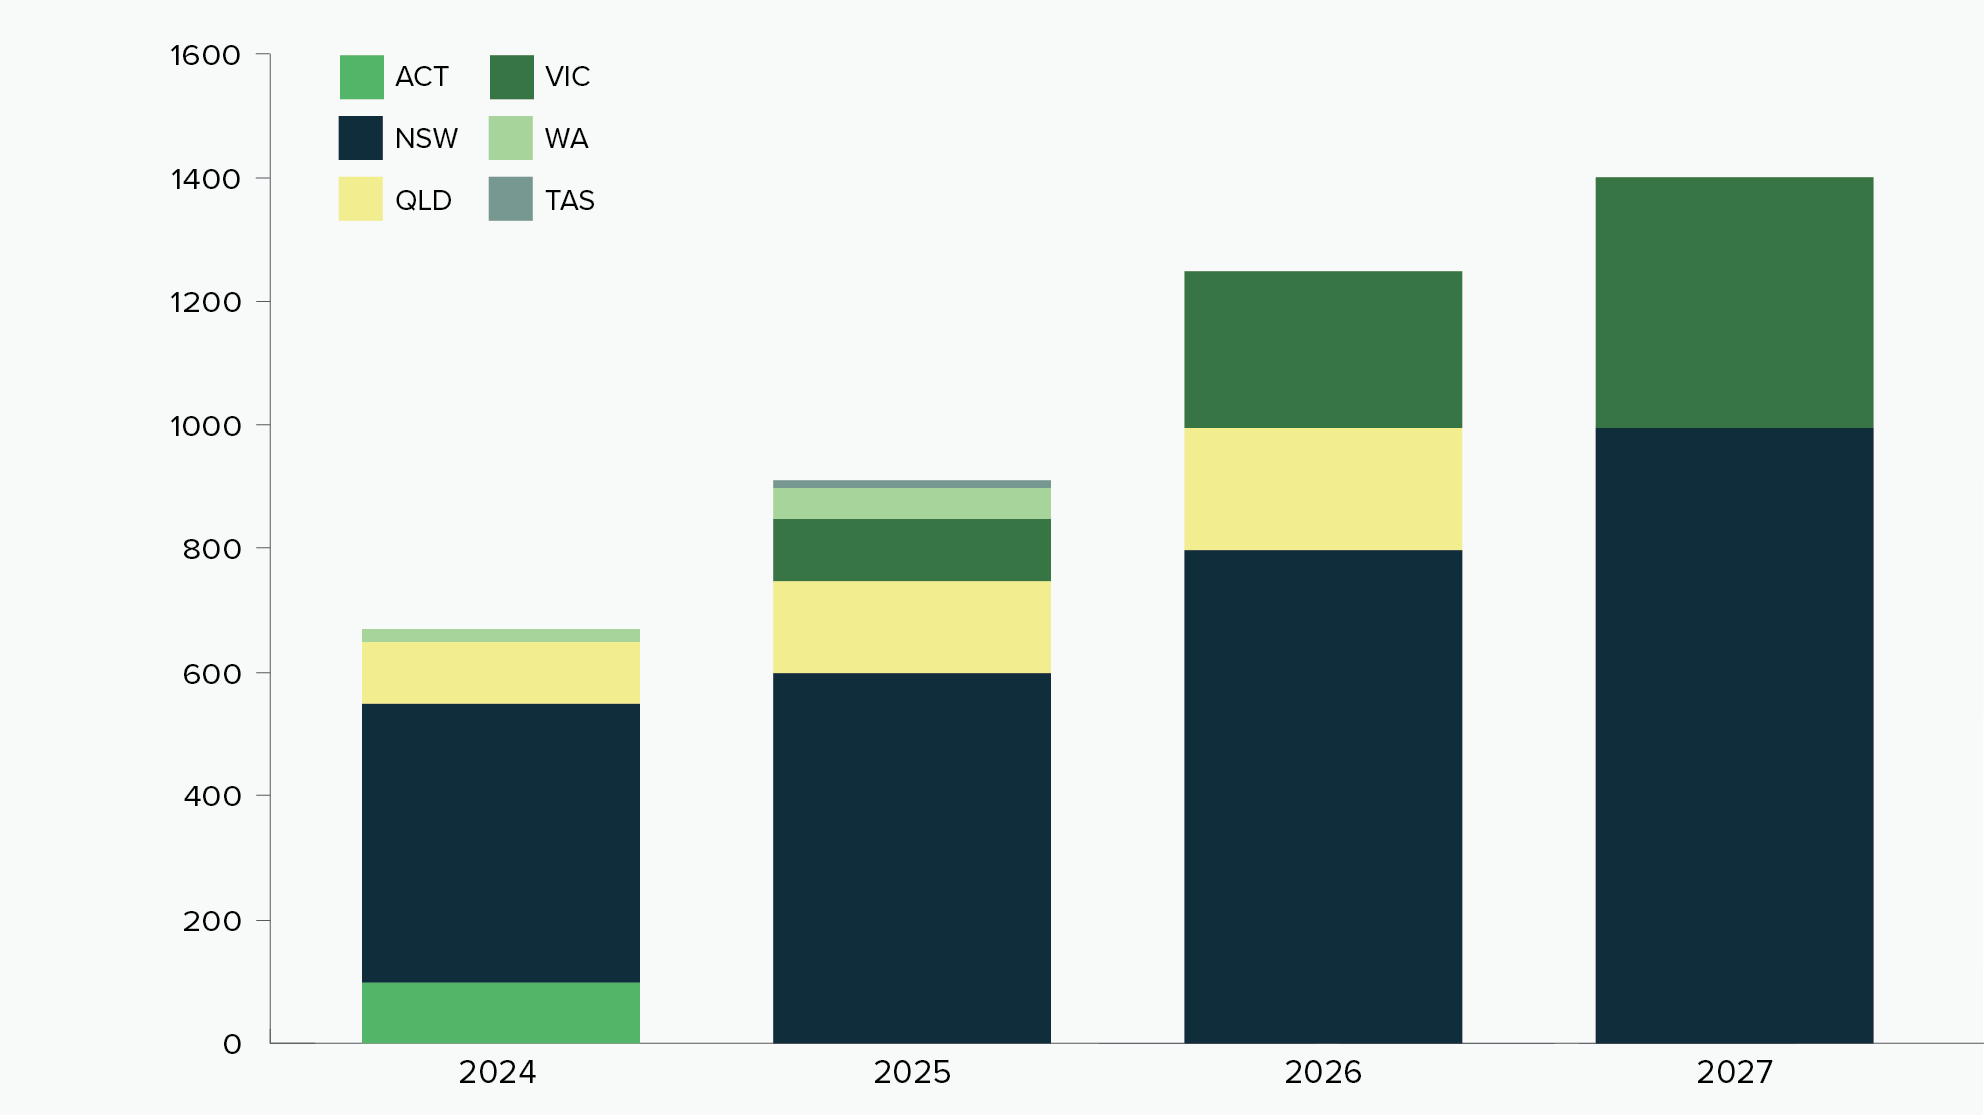
Source: Infrastructure Australia using dashboard data, see Zero Emission Bus Procurement Pipeline
Table 24 identifies where the Australian Government has committed funding for enabling infrastructure for ZEB programs through the Infrastructure Investment Program.
| Jurisdiction |
Planned or underway |
State/Territory Government actions and commitments | Australian Government Commitments |
|---|---|---|---|
| Australia Capital Territory |
|
Zero Emissions Transition Plan for Transport Canberra 2024 Refresh – procurement to buy and lease 106 battery electric buses and depot upgrades.201 | |
| New South Wales |
|
Zero Emissions Bus Transition Plan – complete in Greater Sydney by 2035, in Outer Metropolitan regions by 2040, and in Regional NSW by 2047.202 | $115 million to deliver a new purpose-built electric bus depot in Macquarie Park to house Zero Emission Buses. $100 million to deliver infrastructure for zero emission rapid bus services connecting Penrith, Liverpool, Campbelltown and Blacktown to the Western Sydney International Airport and Aerotropolis. |
| Northern Territory |
|
Investigations underway.203 | |
| Queensland |
|
Zero Emission Bus Program with new buses for South East Queensland from 2025, with regional buses to follow.204 | |
| South Australia |
|
60 new electric buses being delivered from 2025 with all buses and deports to be zero emission by 2050.205 | $2.5 million for planning studies for design modifications required for depot infrastructure. |
| Tasmania |
|
Trial of battery electric buses and hydrogen electric buses underway.206 | $8.5 million to undertake planning for depot upgrades, recharging equipment and electrical network upgrades. |
| Victoria |
|
Zero Emission Bus Transition Plan with commitment for all new public buses purchased from July 2025 to be zero emission.207 | |
| Western Australia |
|
Electric buses currently being rolled out, with commitment for all depots to be upgraded by 2045.208 | $125 million towards delivery of electric bus charging infrastructure. |
Digitalisation is a growing source of new energy demand
Digital technologies like AI are changing the way we work and live. As demand for data storage and processing grows, the data centre sector will expand quickly. While data centres create challenges, they are also enablers of the clean‑energy transition.
Data centres are a substantial new component of energy demand because they require a lot of energy and water to power and cool servers. As this load grows, renewable energy will need to scale up even faster.
AEMO now forecasts data centres as a standalone load. In 2024-25, data centres in the NEM accounted for approximately 2.2% of grid demand. Under the Draft 2026 ISP Step Change Scenario, consumption grows by about 25% per year to around 34 terawatt hours (TWh)xxxi or 12% of grid demand by 2049-50.209 Data centre energy consumption could grow faster if data centre projects are completed faster to meet accelerated AI uptake.
Data centres also act as enabling infrastructure for the energy transition because they can finance new renewable capacity through Power Purchase Agreements (PPAs), operate flexibly to absorb surplus renewable energy, and accelerate digital tools that improve grid efficiency.
PPAs for new data centres help secure financing for wind, solar and storage projects, catalysing private investment and, in turn, accelerating the clean-energy transition. Data centres lead global corporate clean energy PPAs across sectors contracting around 17 GW of renewables in 2024.210 In June 2025, Amazon announced $20 billion of Australian datacentre investments to 2029 and signed PPAs with European Energy for over 170 MW of energy from three solar farms (Victoria and Queensland) to help power those facilities.211
Although data centres increase energy demand, they also have demand-side flexibility, where data centre operators can schedule non‑urgent computing tasks (such as AI model training or large data processing jobs) during periods of high wind or solar output.
Data centres also enable the computing power required by generators, market operators and consumers to vary their electricity feed-in and drawdown to and from the grid. AIenabled forecasting can improve grid efficiency and demand response management flexibility.
10-year national priorities
Currently, buildings and infrastructure are directly responsible for almost one third of Australia’s total GHG emissions, and indirectly responsible for over half of all emissions. Unlike operational emissions, which can be reduced by decarbonising the grid, embodied carbon emissions are locked in once the asset is complete. Reducing embodied GHG emissions generates significant and immediate abatement. Immediate reductions in embodied emissions can be achieved through like-for-like material substitutions, design optimisation, sweating assets and build-less strategies, and linking infrastructure at the earliest stages of delivery to emissions targets.
There is an opportunity for all states and territories to transition existing public bus fleets to zero emissions buses by upgrading bus depot infrastructure. The 2026 Infrastructure Priority List identifies:
- Enabling infrastructure for NSW Zero Emissions Buses – Future stages as an immediate priority for planning investment to define the infrastructure required to support the deployment of ZEBs across the state of New South Wales. The program involves upgrading existing depots, building new depots, and implementing smart technology to manage power draw from the grid.
- Enabling infrastructure for South Australia Zero Emissions Buses proposes upgrades to depot infrastructure to support the transition of more than 1,000 buses to zero-emissions technologies. This proposal is identified as a priority for future investment in the 2-4 year pipeline given the Australian Government has committed $2.5 million for planning studies for upgrades to depot infrastructure.
A key step towards infrastructure decarbonisation is developing domestic production of low-emissions and green steel. The 2026 Infrastructure Priority List includes the Whyalla industrial precinct enabling infrastructure proposal in South Australia as a future investment opportunity in the 2-4 year pipeline to investigate the transformation of Whyalla Steelworks into a commercially viable, low-emissions iron and steel facility. Key constraints include insufficient electricity grid capacity, limited gas supply via the Port Pirie Lateral Pipeline, constrained water supply, and aging port infrastructure.
_____
xxx Scope 1 refers to GHG emissions from sources directly owned or controlled by the infrastructure operator. Scope 2 covers indirect emissions from the generation of purchased energy that the infrastructure operator consumes.
xxvii Publicly funded infrastructure projects valued over $100 million in New South Wales, Victoria, Queensland and Western Australia, and over $50 million in South Australia, the Australian Capital Territory, the Northern Territory and Tasmania.
xxviii Noting from 2024–25 to 2028–29 the Major Public Infrastructure Pipeline (projects >$100m in size) will need 3.6 million tonnes of steel, steel has emissions factor of 2.2 kg per CO₂e /kg and that Australian steel production currently accounts for roughly 24 million tonnes (Mt) CO₂e annually.
xxix The hierarchy emphasises a step-by-step strategy: first avoid emissions, then reduce absolute emissions, substitute with renewable energy sources, neutralise or remove residual emissions through technological or biological methods, and finally compensate through high-quality carbon credits.
xxxi One terawatt hour is a unit of energy representing one trillion watt hours, or one million MWh.