
Enabling infrastructure for the energy transition
Optimising the freight task to deliver onshore wind infrastructure
17 November 2026
Executive summary
Australia’s pathway to net zero depends on the rapid delivery of renewable energy generation, storage and transmission infrastructure. Onshore wind generation is a critical and fast-growing pillar of the nation’s clean energy future.
Freight operations, regulations and infrastructure needed for transporting over-size, over-mass (OSOM) wind turbine components are essential enablers for the efficient and timely roll-out of onshore wind infrastructure.
This report assesses enabling port and road network infrastructure needed to deliver large-scale onshore wind projects and identifies priority areas for infrastructure investment, coordination and reform to optimise the delivery task.
The clean energy transition is fundamental to achieving net zero and attracting major public and private investment
Australia is targeting a 62–70% reduction in emissions by 2035 and net zero by 2050. A transformational shift to renewable energy generation, supported by dispatchable storage, transmission networks and flexible gas generation, is fundamental to success.
The trajectory to achieve net zero depends on major uplift in renewable energy generation by 2030 and beyond, replacing retiring coal generation and meeting rapidly rising electricity demand. Energy accounts for around 90% of net emissions, while forecast demand in the National Electricity Market will nearly double by 2050 and require a five-fold increase in grid-scale wind and solar capacity.
Governments and industry are already responding at scale. The Australian Government has backed the transition through major national reforms and funding, including the Rewiring the Nation program,1 the Capacity Investment Scheme2 and reforms to the Environment Protection and Biodiversity Conservation (EPBC) Act,3 while states and territories are also implementing a range of planning reforms, public investments and market mechanisms to accelerate delivery.
Public investment in major utilities infrastructure has been projected at $36 billion over the five years from 2024–25 to 2028–29, nearly double the $20 billion projected in 2024 (according to Infrastructure Australia’s 2025 Infrastructure Market Capacity Report).4 At the same time, private-sector activity has been surging, and the national five-year energy infrastructure pipeline has been projected at $163 billion spanning transmission, solar, wind and pumped hydro infrastructure.
Onshore wind is a critical pillar of the transition and delivery involves a complex and growing freight and logistics task
Against this backdrop, onshore wind is essential to success. Of the 35.3 GW of new utility-scale wind and solar capacity needed in the National Electricity Market by 2029–30, 14.1 GW (40%) is onshore wind. Delivering this infrastructure at the required pace faces several challenges, including the need to coordinate grid connections, address social licence risks and provide the enabling infrastructure needed to support construction, operation, renewal and decommissioning.
This includes the enabling infrastructure needed for the complex and unique freight task involved in transporting very large turbine components through ports and across freight corridors to construction locations, which is the main focus of this report.
We analysed 56 onshore wind projects expected to start construction before 2030, which require more than 4,500 turbines to be imported and transported from ports to project sites. We estimate this will involve over 62,000 over-size, over-mass (OSOM) vehicle movements between Q3 2025 and Q4 2030, with annual demand rising to over 18,500 such movements by 2027.
This demand is highly concentrated. Ports including Newcastle, Portland, Geelong, Gladstone, Brisbane, Townsville and Adelaide are expected to carry much of the task. Newcastle alone is projected to handle over 14,000 turbine components, with peak demand exceeding 17 movements a day by 2027. National road networks are equally critical, with 65% of OSOM travel for wind turbine deliveries on national freight networks. Our analysis identifies eight major freight corridors across Queensland, New South Wales, Victoria and South Australia that will be essential to delivery.
The freight task for onshore wind is a national productivity challenge requiring a coordinated national response
The scale and pace of accelerating demand for onshore wind delivery, and the ever-increasing dimensions of turbines, will put substantial pressure on the infrastructure, regulatory and operational systems and resources needed to manage delivery. This includes the capacity of our ports, the ability to move turbines from ports onto major freight routes, and the adequacy of these roads to transport over-dimension turbine components such as blades, tower sections and nacelles.
The report finds that the current project-by-project approach is unlikely to be sufficient for the scale of development now underway. More than 900 route constraints have been identified across the road network, with 47% on national freight routes and many involving complex bridge, height and port access issues.
Peak periods of demand for over-size, over-mass (OSOM) turbine movements will exceed the practical capacity of our infrastructure and supply chains, creating risks of delays to project schedules and the delivery of vital onshore wind capacity. The freight task for onshore wind also involves significant freight transport costs, some of which are potentially avoidable by addressing constraints and inefficiencies such as duplicated planning, approvals and infrastructure bottlenecks.
The freight task for onshore wind must be treated as a national productivity and optimisation challenge, not simply a set of individual project logistics tasks, with Australian, state and territory governments needing to perform a vital coordinating role.
We have identified national priorities for infrastructure investment and reform to enable and optimise delivery
The report identifies four nationally significant priorities for further investigation and investment to address infrastructure needs on critical corridors to enable OSOM vehicle access for renewable energy projects and support broader road network productivity, safety and resilience:
- The Port of Gladstone to Central Queensland.
- The Port of Newcastle to the Central West-Orana Renewable Energy Zone.
- The Ports of Newcastle and Brisbane to the New England Renewable Energy Zone.
- The Ports of Adelaide and Geelong to the South West Renewable Energy Zone.
The report also points to the need for broader policy and regulatory reform. This includes the identification and coordinated assessment of strategically important freight routes, streamlined and more harmonised access arrangements, reform of pilot and escort requirements, and clearer limits on turbine and vehicle dimensions that freight networks can reasonably accommodate.
Together, these actions would reduce duplication, improve certainty, lower avoidable costs and strengthen Australia’s capacity to deliver the large-scale onshore wind build-out required for an efficient, timely clean energy transition.
The clean energy delivery challenge
Australia’s clean energy transition is central to achieving net zero by 2050, replacing retiring coal generation and meeting rising electricity demand through major expansion of renewable energy generation, storage and transmission infrastructure.
Governments and industry are driving the transition through significant policy reform and investment, with strong growth in public funding, private capital and large-scale energy infrastructure to achieve national targets and meet rising electricity demand.
Onshore wind generation is a critical part of this build-out, with rapidly growing demand for wind development to 2030 and sustained growth out to 2050. Delivering the scale and pace of onshore wind deployment involves managing a complex freight task and the associated infrastructure, regulatory, operational and social challenges.
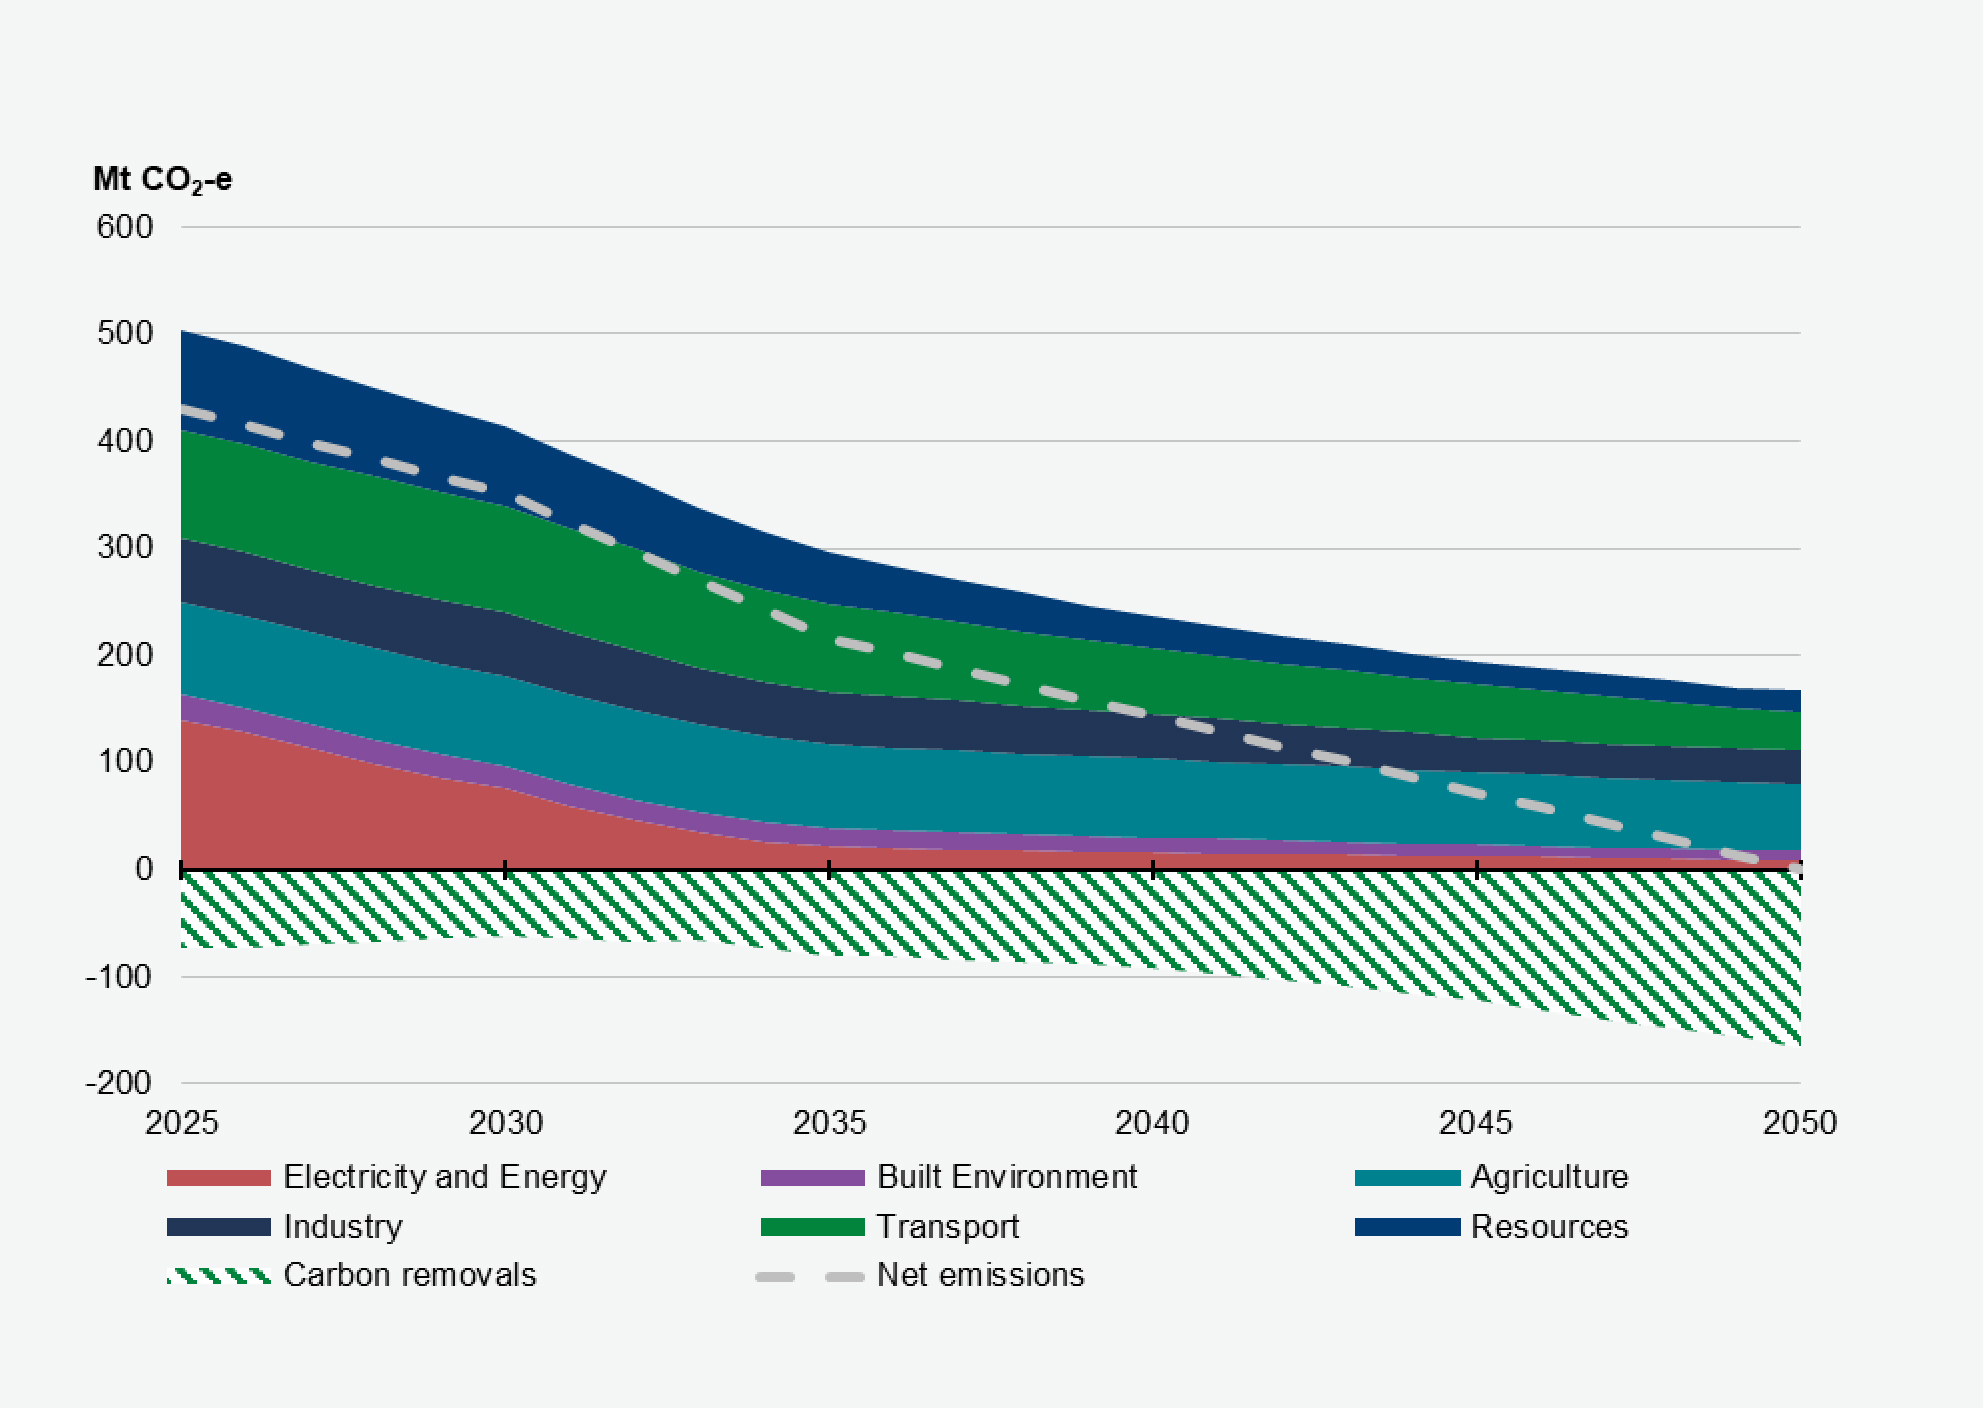
Figure 1: Projected emissions reductions, by sector, Baseline Scenario
Source: Commonwealth Treasury (2025)5
The clean energy transition is critical to achieving net zero and meeting Australia’s rising electricity demand
The Australian Government has set a national target to achieve net zero greenhouse gas emissions by 2050, underpinned by a 2035 target of 62–70% below 2005 levels.
Most of Australia’s emissions come from producing and using energy, which accounts for around 90% of Australia’s net emissions.6 Decarbonising the energy system reduces emissions within the sector and provides the foundation to cutting emissions across the economy in other sectors such as transport, industry and resources. A rapid shift to renewable energy is essential to deliver near term emissions reductions and keep the country on the trajectory to net zero (Figure 1).7
Our nation’s renewable energy resources are vital to getting there, with the rapid expansion of renewable energy supply the most cost-efficient pathway to large scale abatement.8 Australia’s ageing coal-fired power stations are nearing retirement, with most expected to retire by the mid-2030s. Their exit will accelerate the shift towards renewables, supported by storage and flexible gas generation in a smaller but important firming role.
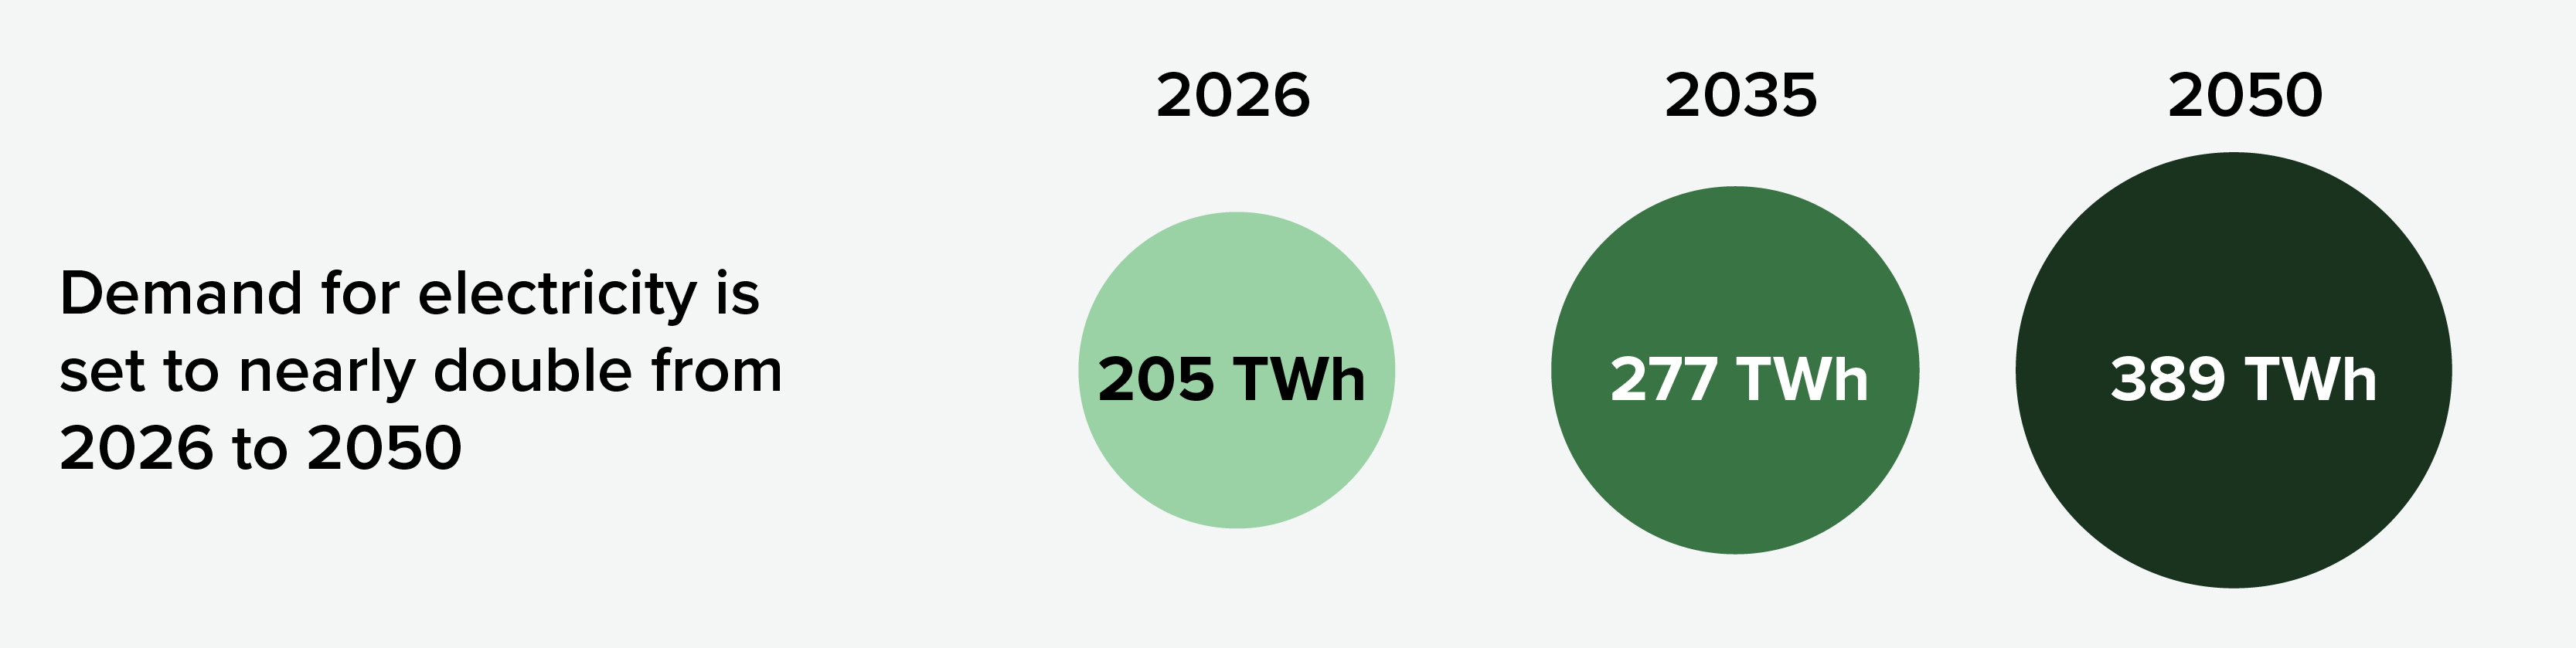
The nation’s two largest electricity grids – the National Electricity Market (NEM) and the South West Interconnected System (SWIS) – now source more than 40% of their supply from renewable sources.9 This momentum must continue to scale up to achieve net zero and meet rapid growth in electricity demand, which for the NEM is set to nearly double between 2024 and 2050 (Figure 2).
The Australian Government’s Electricity and Energy Sector Plan highlights major drivers of demand growth as electrification gathers pace across the economy, including emerging and accelerating sources of demand such as data centres.10 These developments will reshape how and when energy is used, with greater variability, shifting peaks and larger, more concentrated loads. This requires a coordinated expansion of renewable generation, energy storage and transmission across the system, with a five-fold increase in grid-scale wind and solar generation capacity needed by 2050.11
Figure 2: Electricity demand is forecast to nearly double by 2050
Source: Infrastructure Australia; Australian Energy Market Operator (2025)12
Australian governments are acting to enable and accelerate the transition to renewable energy
Governments at all levels have a critical role in the energy transition. Australian, state and territory governments are setting direction through legislation, policy and targets, making major investments and introducing vital reforms to enable, coordinate and accelerate delivery (Appendix A).
At the national level, this includes the Net Zero Plan, $20 billion for the Rewiring the Nation program and $73 billion of investment through the Capacity Investment Scheme. The Clean Energy Finance Corporation and the Australian Renewable Energy Agency also provide substantial funding and financing for development and delivery of clean energy projects and low emission technologies.
Infrastructure Australia’s 2025 Infrastructure Market Capacity report finds that projected public investment in major utilities infrastructure over the five years between 2024–25 to 2028–29 is $36 billion, nearly double the $20 billion projected in 2024. This increase is primarily due to uplift in transmission investments across five of eight states and territories, which now account for $15 billion across the five-year outlook, up from $4 billion the year before.13
Industry is responding with surging private energy investment
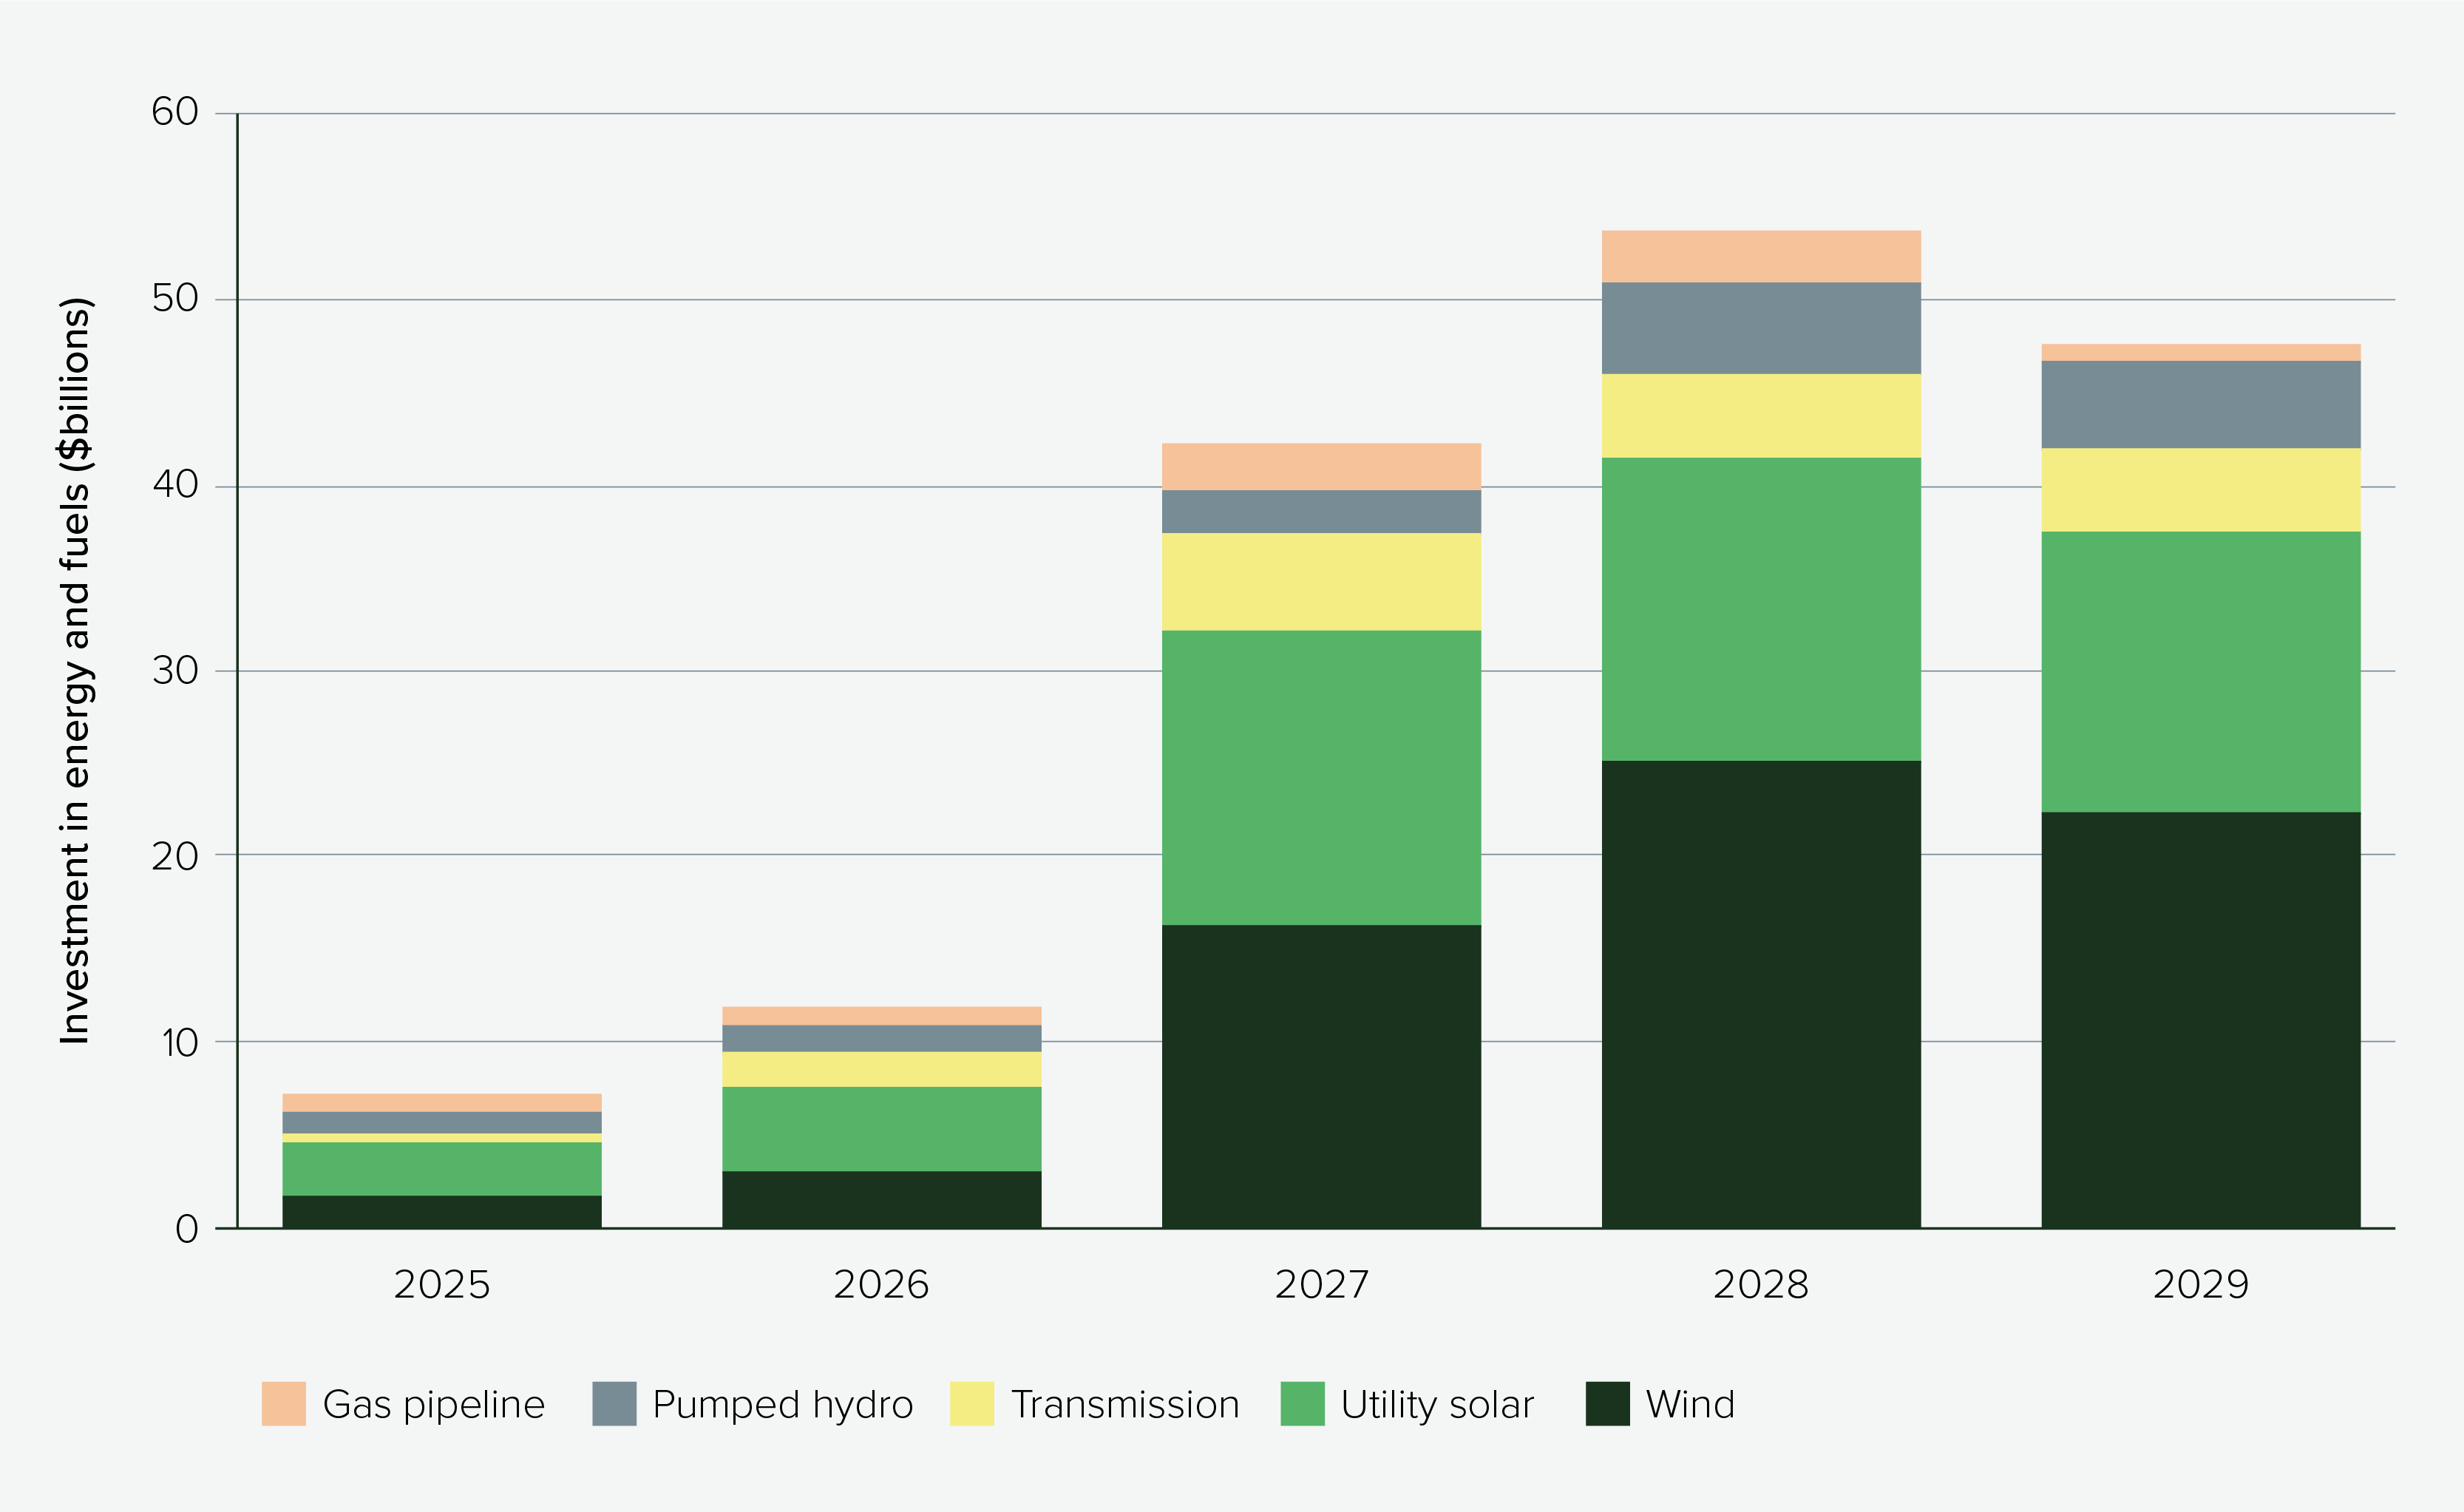
Australia’s energy transition is being powered by record levels of private investment in renewable energy infrastructure. Infrastructure Australia’s 2025 Infrastructure Market Capacity report projected the national pipeline of energy infrastructure, including transmission, solar, wind and pumped hydro projects is $163 billion for the five years from 2024–25 to 2028–29 (Figure 3).
Timely delivery of this infrastructure will be vital to stay on track to deliver the target of 82% renewable electricity by 2030 and uplift in renewables needed by 2050, with renewables projected to supply a dominant share of electricity generation in the National Electricity Market by 2050.14
Figure 3: Forward pipeline of energy infrastructure investment in Australia (2024–25 to 2028–29)
Source: Infrastructure Australia (2025)
Onshore wind is a critical pillar of Australia’s energy transition, and the level of demand presents a complex delivery task
Onshore wind generation capacity is essential to meet Australia’s renewable energy needs. In the five years to 2029–2030, of 35.3 GW new utility-scale wind and solar capacity needed in the National Electricity Market, 14.1 GW (40%) is onshore wind.15 As shown in Figure 3, this is reflected in onshore wind projects accounting for over 40% of the national energy infrastructure pipeline.
This highlights the scale and accelerating pace of onshore wind development in the period to 2030 as the nation strives to deliver generation capacity, energy security and emissions reduction targets.
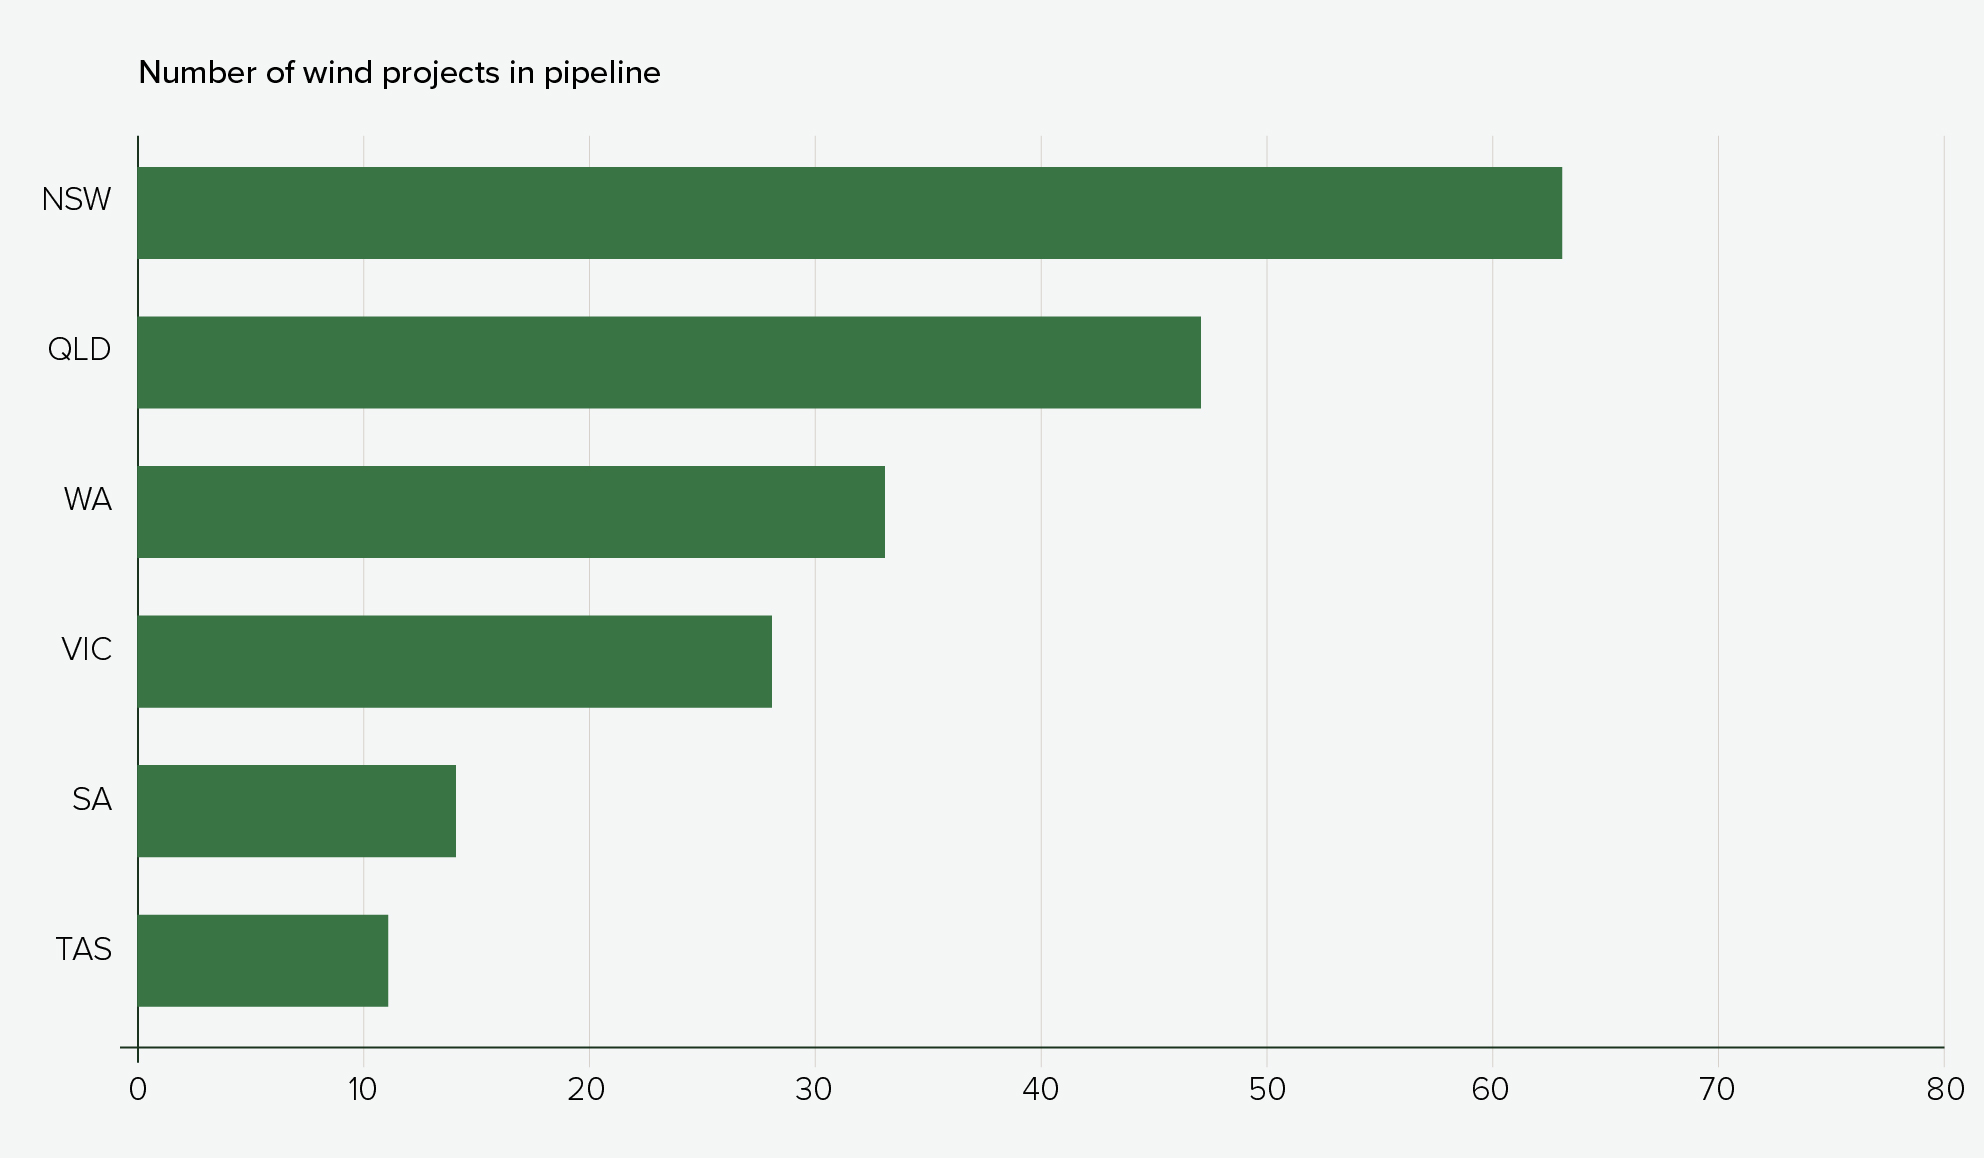
The pipeline for utility-scale wind projects planned in the five-year outlook period shows significant development activity in eastern states (Figure 4) – reflecting the dominant national share of energy generation in these jurisdictions – with Western Australia also seeing strong development activity.
Figure 4: Number of utility-scale wind projects in the infrastructure pipeline as of July 2025, by jurisdiction
Note: Excludes projects that started construction by July 2025.
Source: Infrastructure Australia (2025).
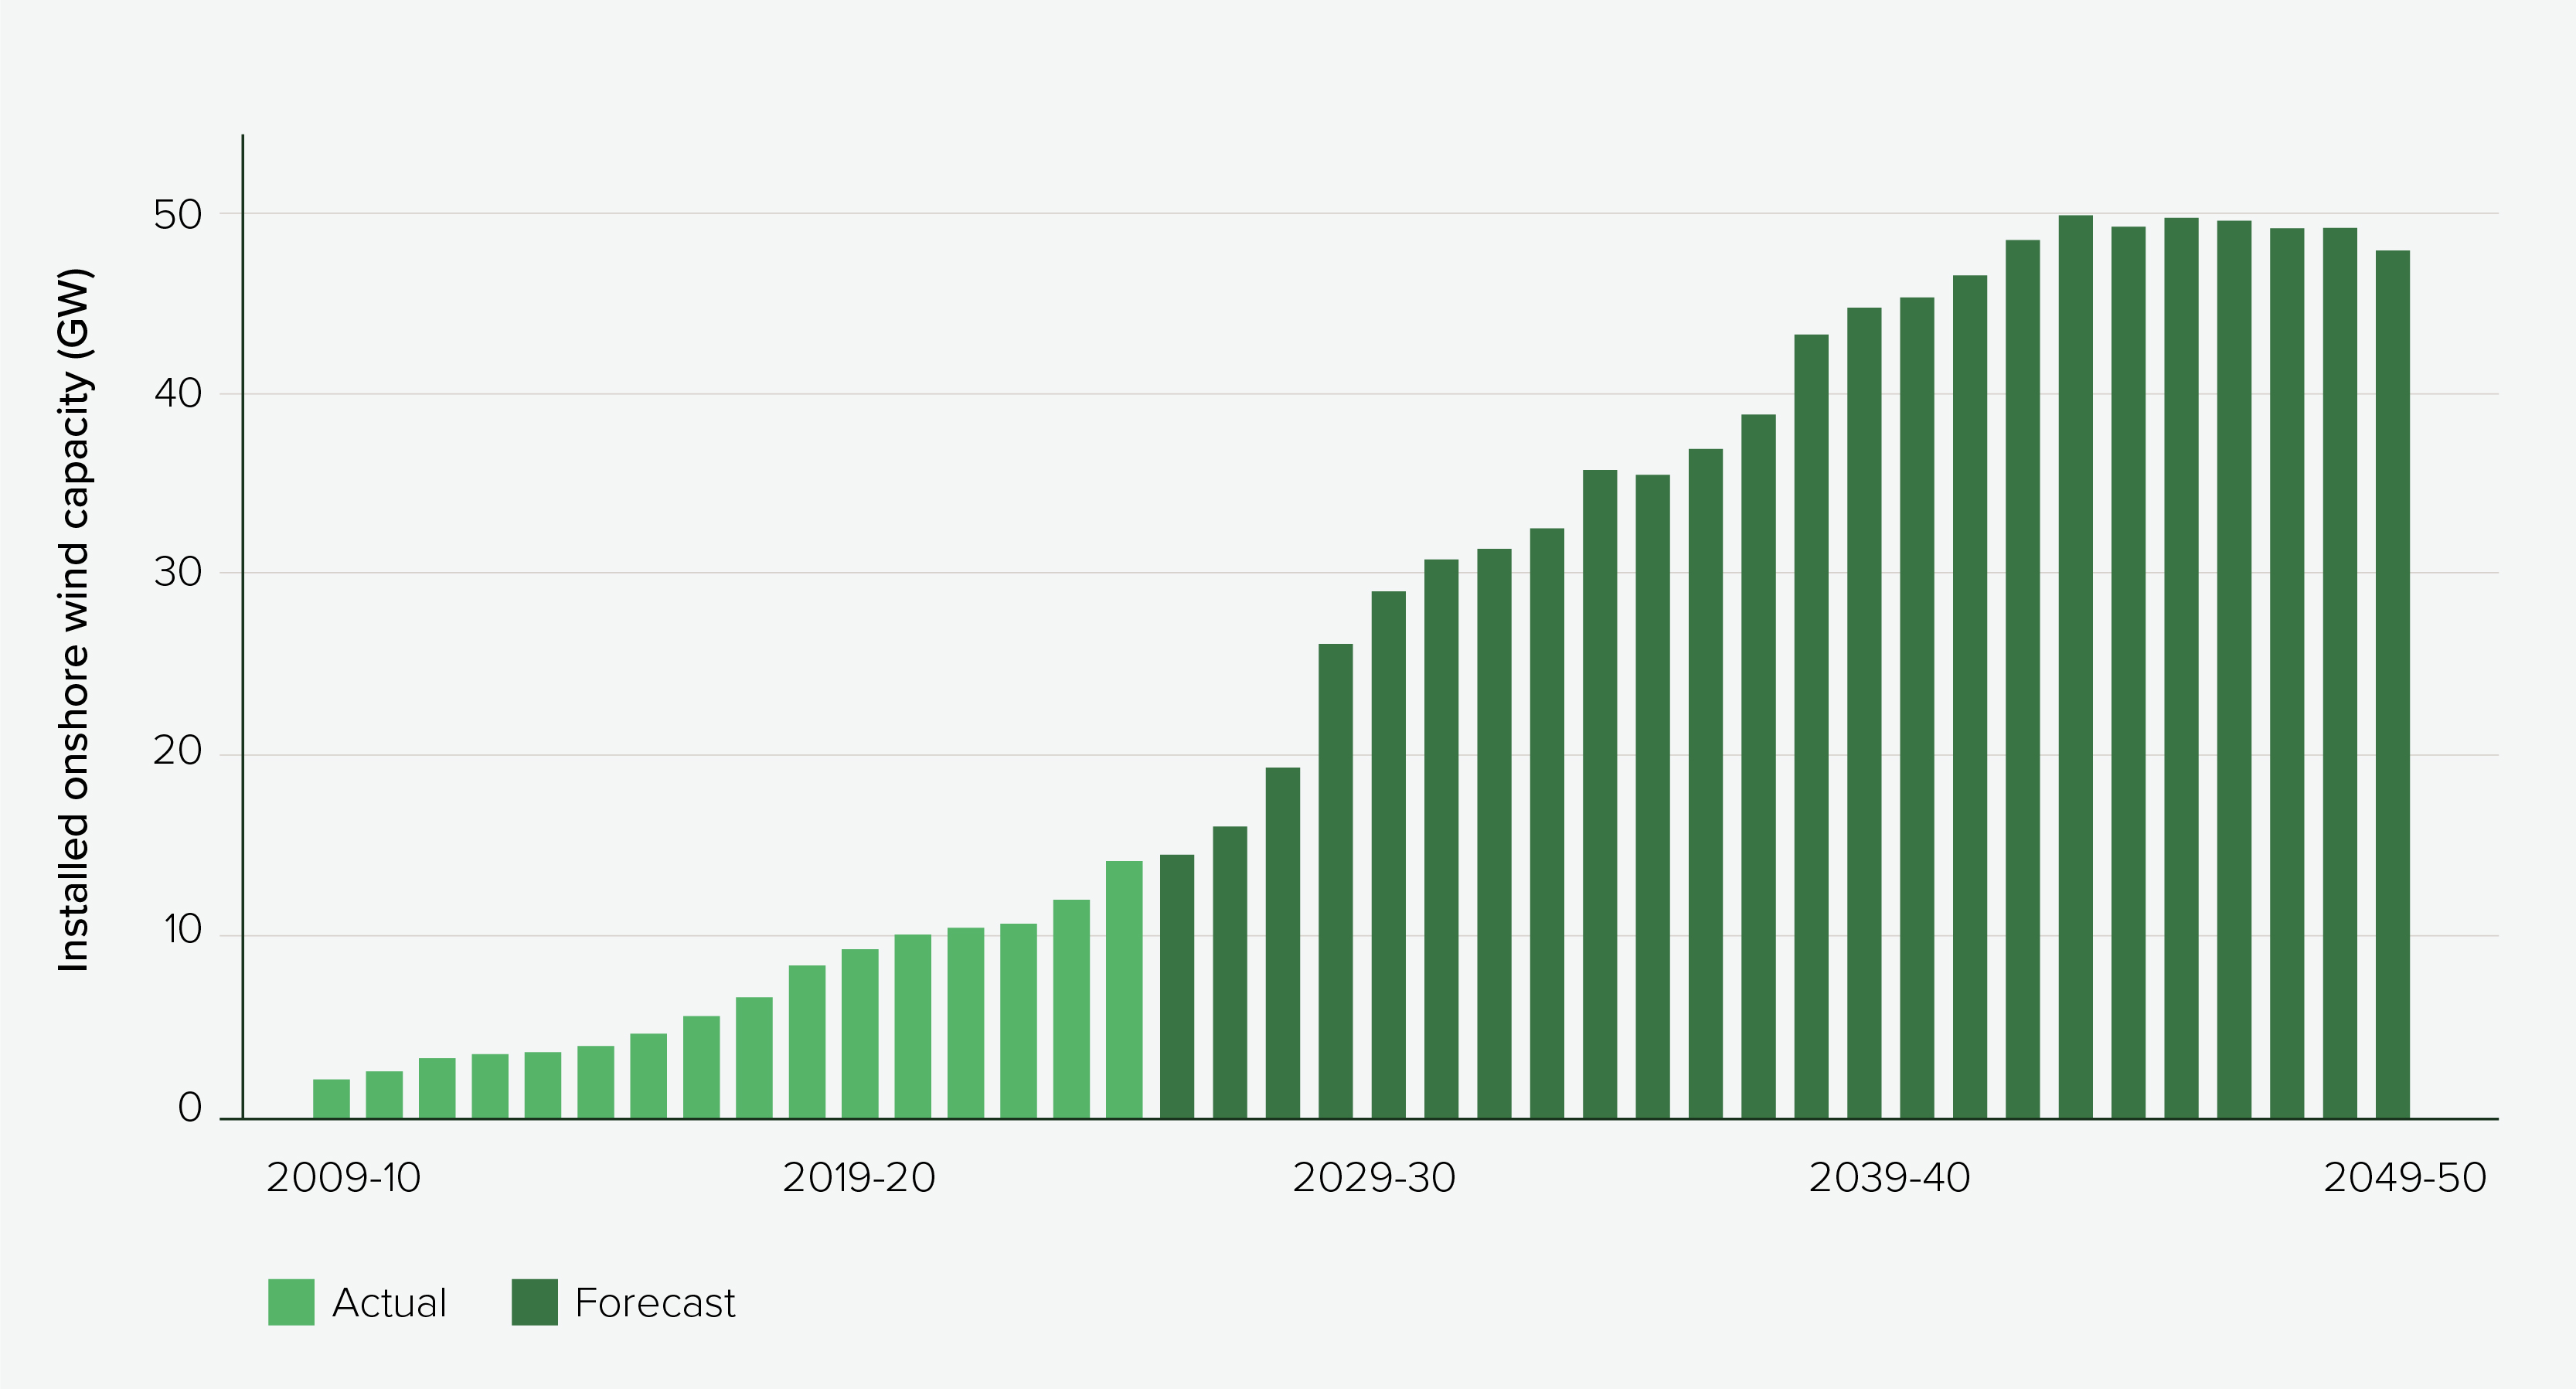
Increased installation of wind capacity will also be sustained over the longer term to meet growing electricity demand and net zero goals. The latest Australian Energy Market Operator (AEMO) estimates show installed onshore wind capacity is forecast to more than double in five years, from 14.1 GW in 2025/26 to 29 GW by 2030/31 and projected to reach 48 GW by 2050 (Figure 5).
Figure 5: Actual and forecast installed grid-scale onshore wind capacity in the National Electricity Market (2009–10 to 2049–50)
Source: Infrastructure Australia; Australian Energy Market Operator (2025)16
The rapid increase in onshore wind projects is accompanied by the need to coordinate grid connections, address community concerns and social licence risks, and provide the supporting infrastructure needed to enable construction, operation and de-commissioning of these assets.
Part of this delivery challenge involves managing the unique freight and logistics task needed to deliver this infrastructure. Wind turbine components, including blades, tower sections, nacelles and transformers, are complex to import and transport using over-size, over-mass (OSOM) vehicles.
The delivery task for onshore wind creates significant additional demand for these complex freight operations and presents a range of infrastructure, regulatory, operational and social challenges that, without effective coordination, can lead to inefficiencies, increased costs and delays to delivery.
Assessing the freight delivery task and associated infrastructure challenges, needs and opportunities to support the timely and efficient roll-out of onshore wind development is the focus of this report.
Purpose and scope
Identification of priorities for infrastructure optimisation to support the unique delivery challenges of onshore wind
Australia’s energy transition requires coordinated planning and delivery, and investments in renewable energy generation, transmission and storage as well as enabling infrastructure such as transport, water and social infrastructure. This report focuses on the unique, complex and growing freight task to support delivery of utility-scale onshore wind projects.
The report presents our analysis of freight infrastructure demands and challenges of over-size, over-mass (OSOM) vehicle movements for onshore wind projects. It identifies priority opportunities for infrastructure investment, coordination and reform to optimise the transportation of wind turbines across the network to support an efficient, safe and timely roll-out of renewable energy capacity.
This includes identifying four targeted, nationally significant infrastructure investment priorities, which were included in Infrastructure Australia’s 2026 Infrastructure Priority List.
Assessment of demand and constraints for onshore wind freight and associated infrastructure needs and opportunities
Our analysis, conducted in 2025, used Infrastructure Australia’s Market Capacity data, published planning information on individual wind projects, and other public information sources, to:
- Quantify projected unconstrained demand for wind turbine imports through ports.
- Identify planned freight routes to transport wind turbines from ports to project sites.
- Assess infrastructure constraints that may impede delivery.
Our analysis was supported by extensive engagement with government and industry stakeholders and desktop research to inform and validate findings on delivery routes and infrastructure needs, assess broader challenges for delivery and identify potential opportunities for action.
Our analysis was based on wind project data current in 2025. Project timeframes, scope and delivery routes may have changed since the analysis was completed. Details about how we conducted the quantitative analysis as well as limitations can be found in Appendix B.
A national analysis with a focus on Renewable Energy Zones
As of July 2025, there were 197 announced utility-scale onshore wind projects in Australia’s infrastructure planning pipeline at varying stages of development, excluding projects in operation, under construction or in commissioning. Collectively these represent over 143 GW of potential renewable generation capacity, though not all projects are expected to proceed as announced.
We analysed 56 of these onshore wind projects that were planned to start construction before 2030, to provide a more realistic view of potential demand. Projects included in the analysis comprised:
- 21 projects included on the Australian Government’s 2025 National Renewable Energy Priority List, spanning all six states and expected to deliver 14 GW of renewable capacity.17
- 35 projects located in New South Wales, Victoria and Queensland. These represent the three largest energy-generating states, each with identified needs for significant additional onshore wind capacity in the next five to ten years (Figure 6). These 35 projects were prioritised based on proximity to Renewable Energy Zones and a probabilistic assessment to select projects with a higher level of delivery confidence and available information at the time of the analysis.
Figure 6: New grid-scale renewables and onshore wind capacity projected by key states
State | New grid-scale renewable capacity | New onshore wind capacity |
| New South Wales18,19 | 12–16 GW by 2030 | 10.5 GW by 2030 |
| Victoria20 | 11.4 GW by 2035 | 5.4 GW by 2035 |
| Queensland21 | up to 6.8 GW by 2030 | 2.4 GW by 2030, 3.7–6.8 GW by 2035 |
Other jurisdictions are included to a more limited extent. For instance, South Australia and Tasmania are already more advanced in their renewable energy roll-out. Similarly, Western Australia has already made significant investments to enable road networks for over-size, over-mass (OSOM) vehicles, with investments also already underway at ports that will support onshore wind project delivery.22,23
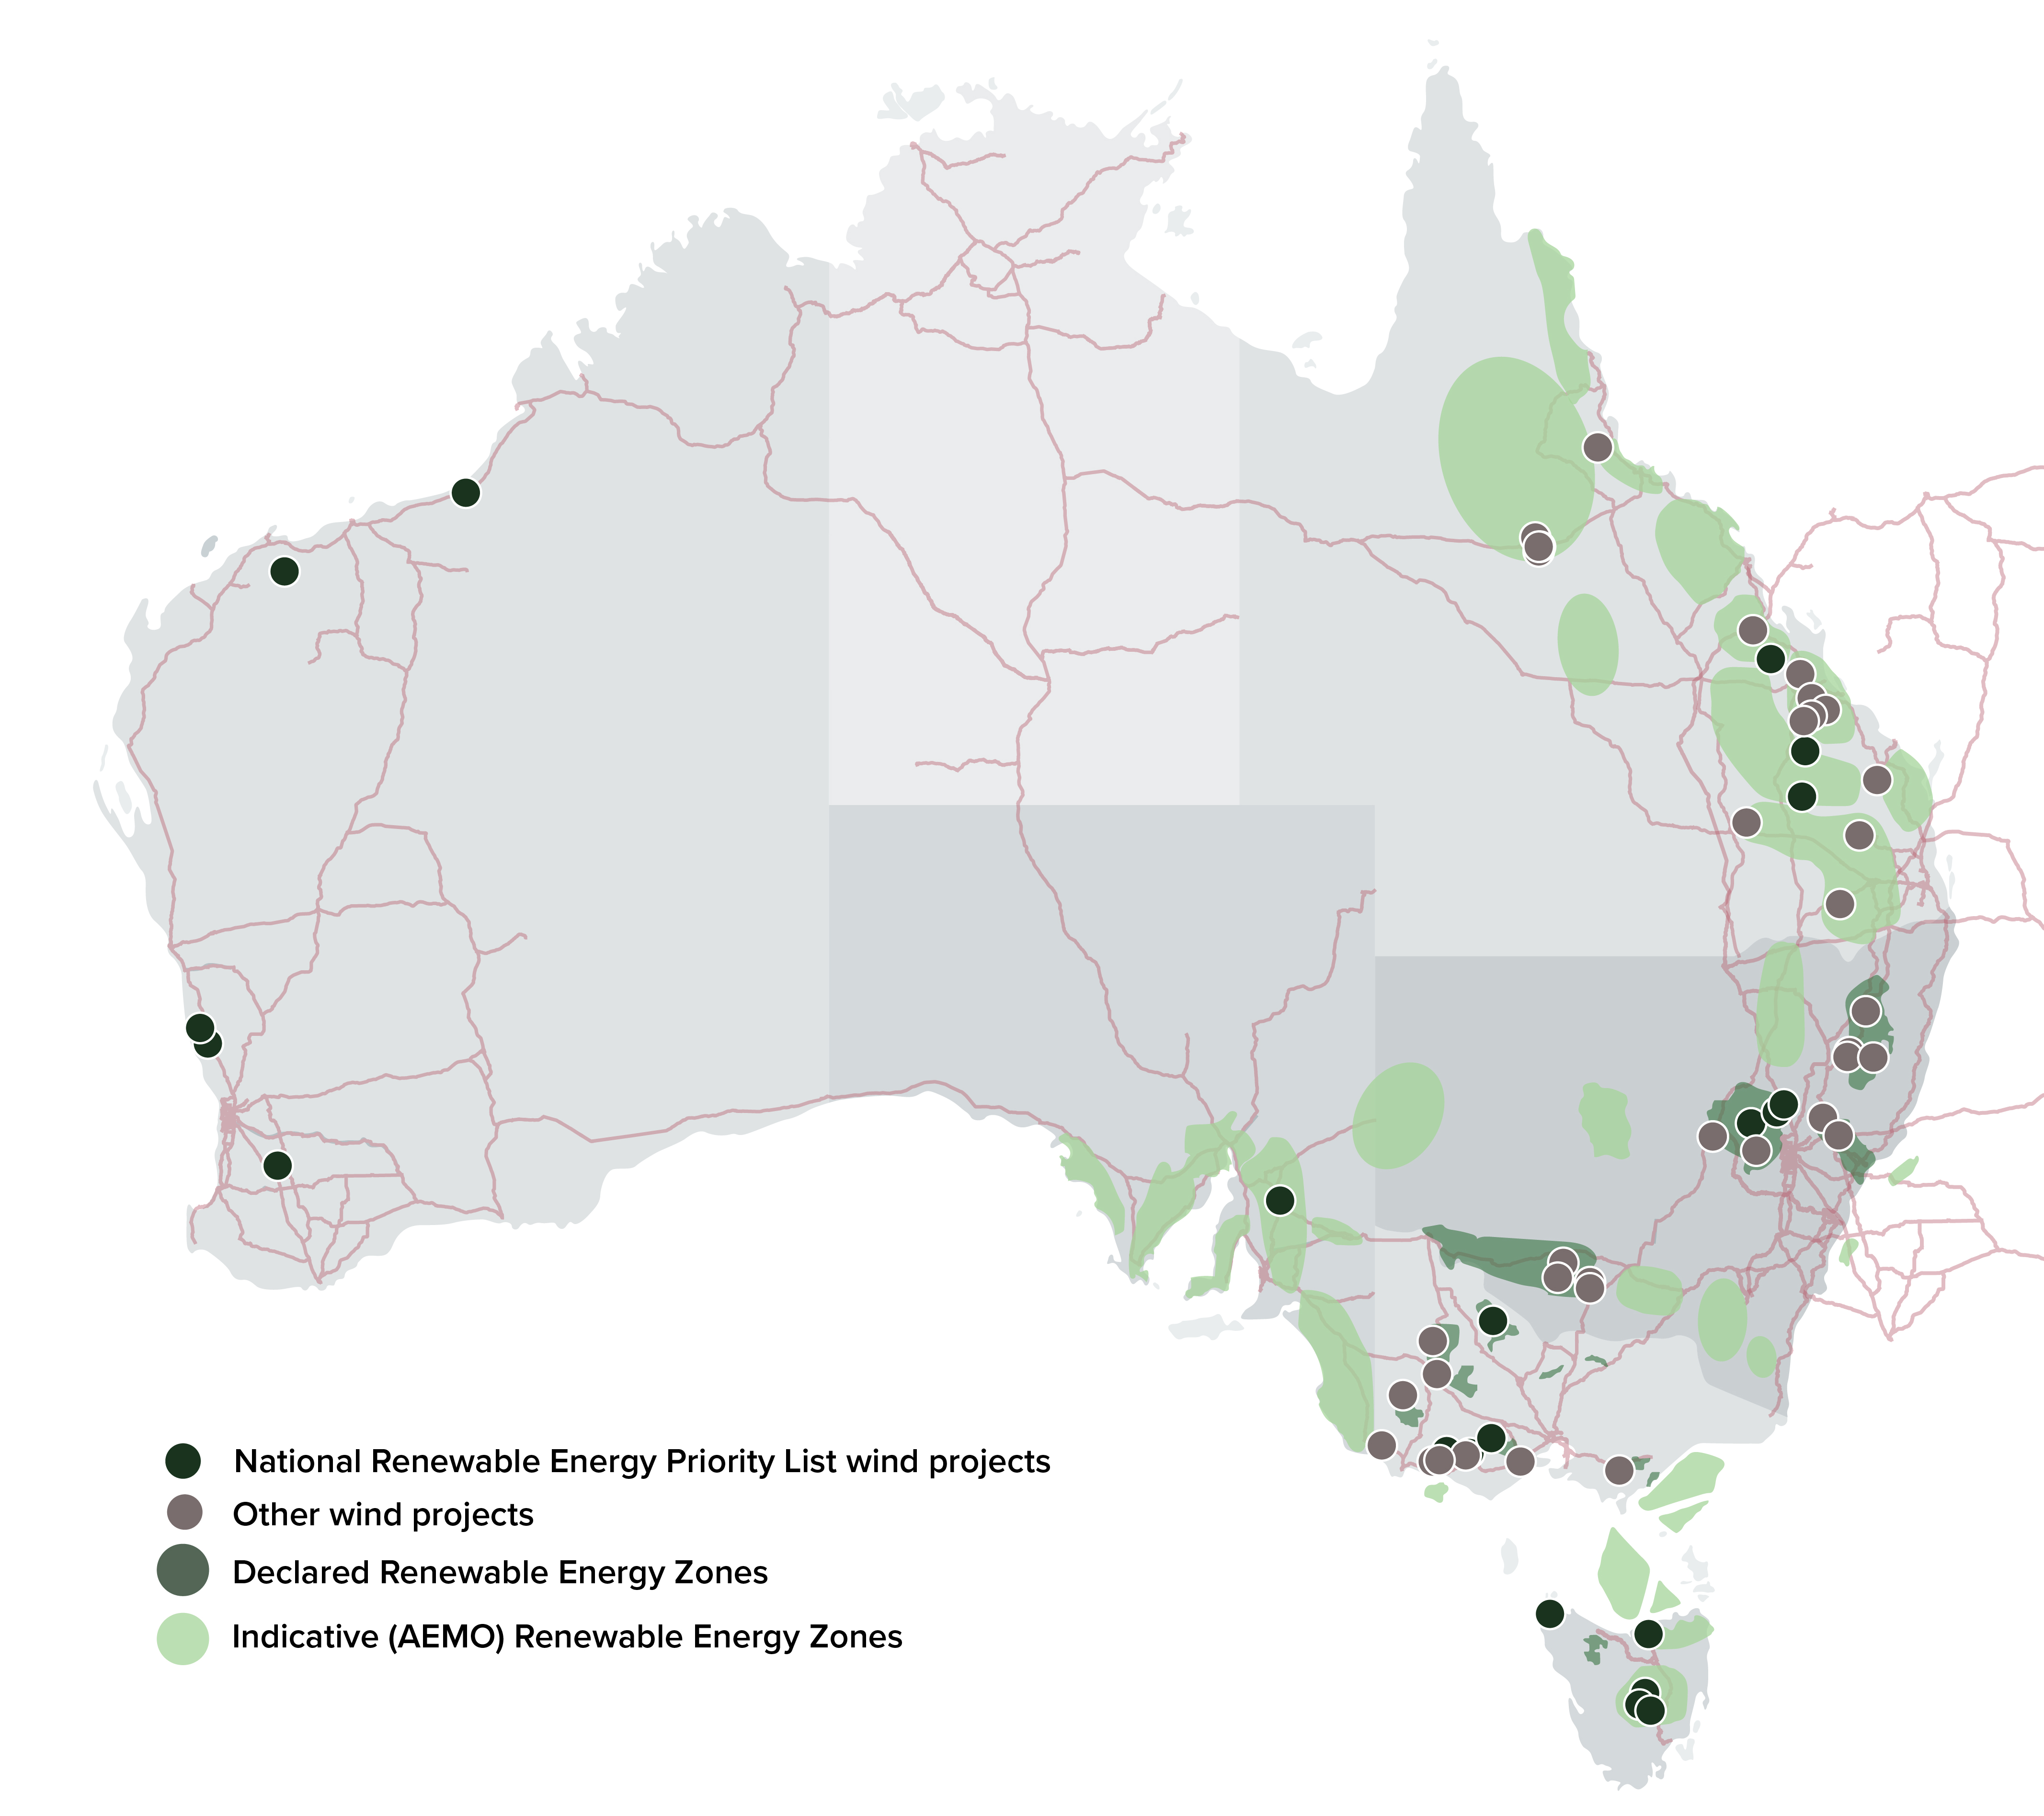
Projects included in our analysis (shown in Figure 7) represent up to around 30 GW of onshore wind generation capacity planned for delivery by 2030. This provides a substantial sample that balances a national scope with in-depth insights for concentrated areas of renewable energy development, to highlight immediate infrastructure challenges to delivery in the next five years, and beyond. Infrastructure Australia may update and expand the scope of this analysis in the future.
Figure 7: Location of wind projects included in our analysis
Demand for over-size, over-mass wind turbine freight
Australia’s onshore wind delivery task requires a major freight effort. The 56 projects analysed by Infrastructure Australia need more than 4,500 turbines to be handled through ports and over 62,000 over-size, over-mass (OSOM) vehicle movements to transport turbine components to project sites between Q3 2025 and Q4 2030.
Ports such as Townsville, Gladstone, Brisbane, Newcastle, Portland, Geelong and Adelaide will carry much of this task, creating concentrated pressure on port capacity and access. Newcastle alone is projected to handle over 14,000 components, with daily demand peaking above 17 movements in late 2027, risking bottlenecks and delays.
National road freight networks are equally critical to delivery. 60% of the identified delivery routes and 65% of vehicle kilometres are on national road networks, with our analysis identifying eight major freight corridors that are essential to move turbine components from ports to project locations to support the roll-out of onshore wind capacity.
Demand for construction of wind projects across the country creates a significant freight task to import and deliver turbines
In our analysis, we modelled the number of wind turbines and over-size, over-mass (OSOM) turbine components projected to enter ports and be transported on road networks over the next five years.
For the 56 projects planned to enter construction, which collectively represent up to about 30 GW of renewable energy generation capacity, unconstrained demand between Q3 2025 to Q4 2030 shows:
- Over 4,500 wind turbines need to be imported and transported from ports to project sites
- Over 62,000 OSOM movements of individual turbine components will be required.
We find that OSOM movements for these projects will accelerate to almost 10,700 OSOM movements in 2026 and up to over 18,500 OSOM movements in 2027.
When compared to existing activity for OSOM movements requiring permits across the whole economy, these movements represent a substantial uplift in demand on Australia’s freight networks (Figure 8). Across the five National Energy Market states, annual OSOM movements are expected to peak (in 2027–28) at up to 69% above the baseline 2024–25 level of activity. Victoria peaks at 86% above this baseline and New South Wales at 63% from an already high base for the state.
Figure 8: Comparison of estimated demand for wind turbine movements (2025–26 to 2029–30) to all OSOM activity for 2024–25
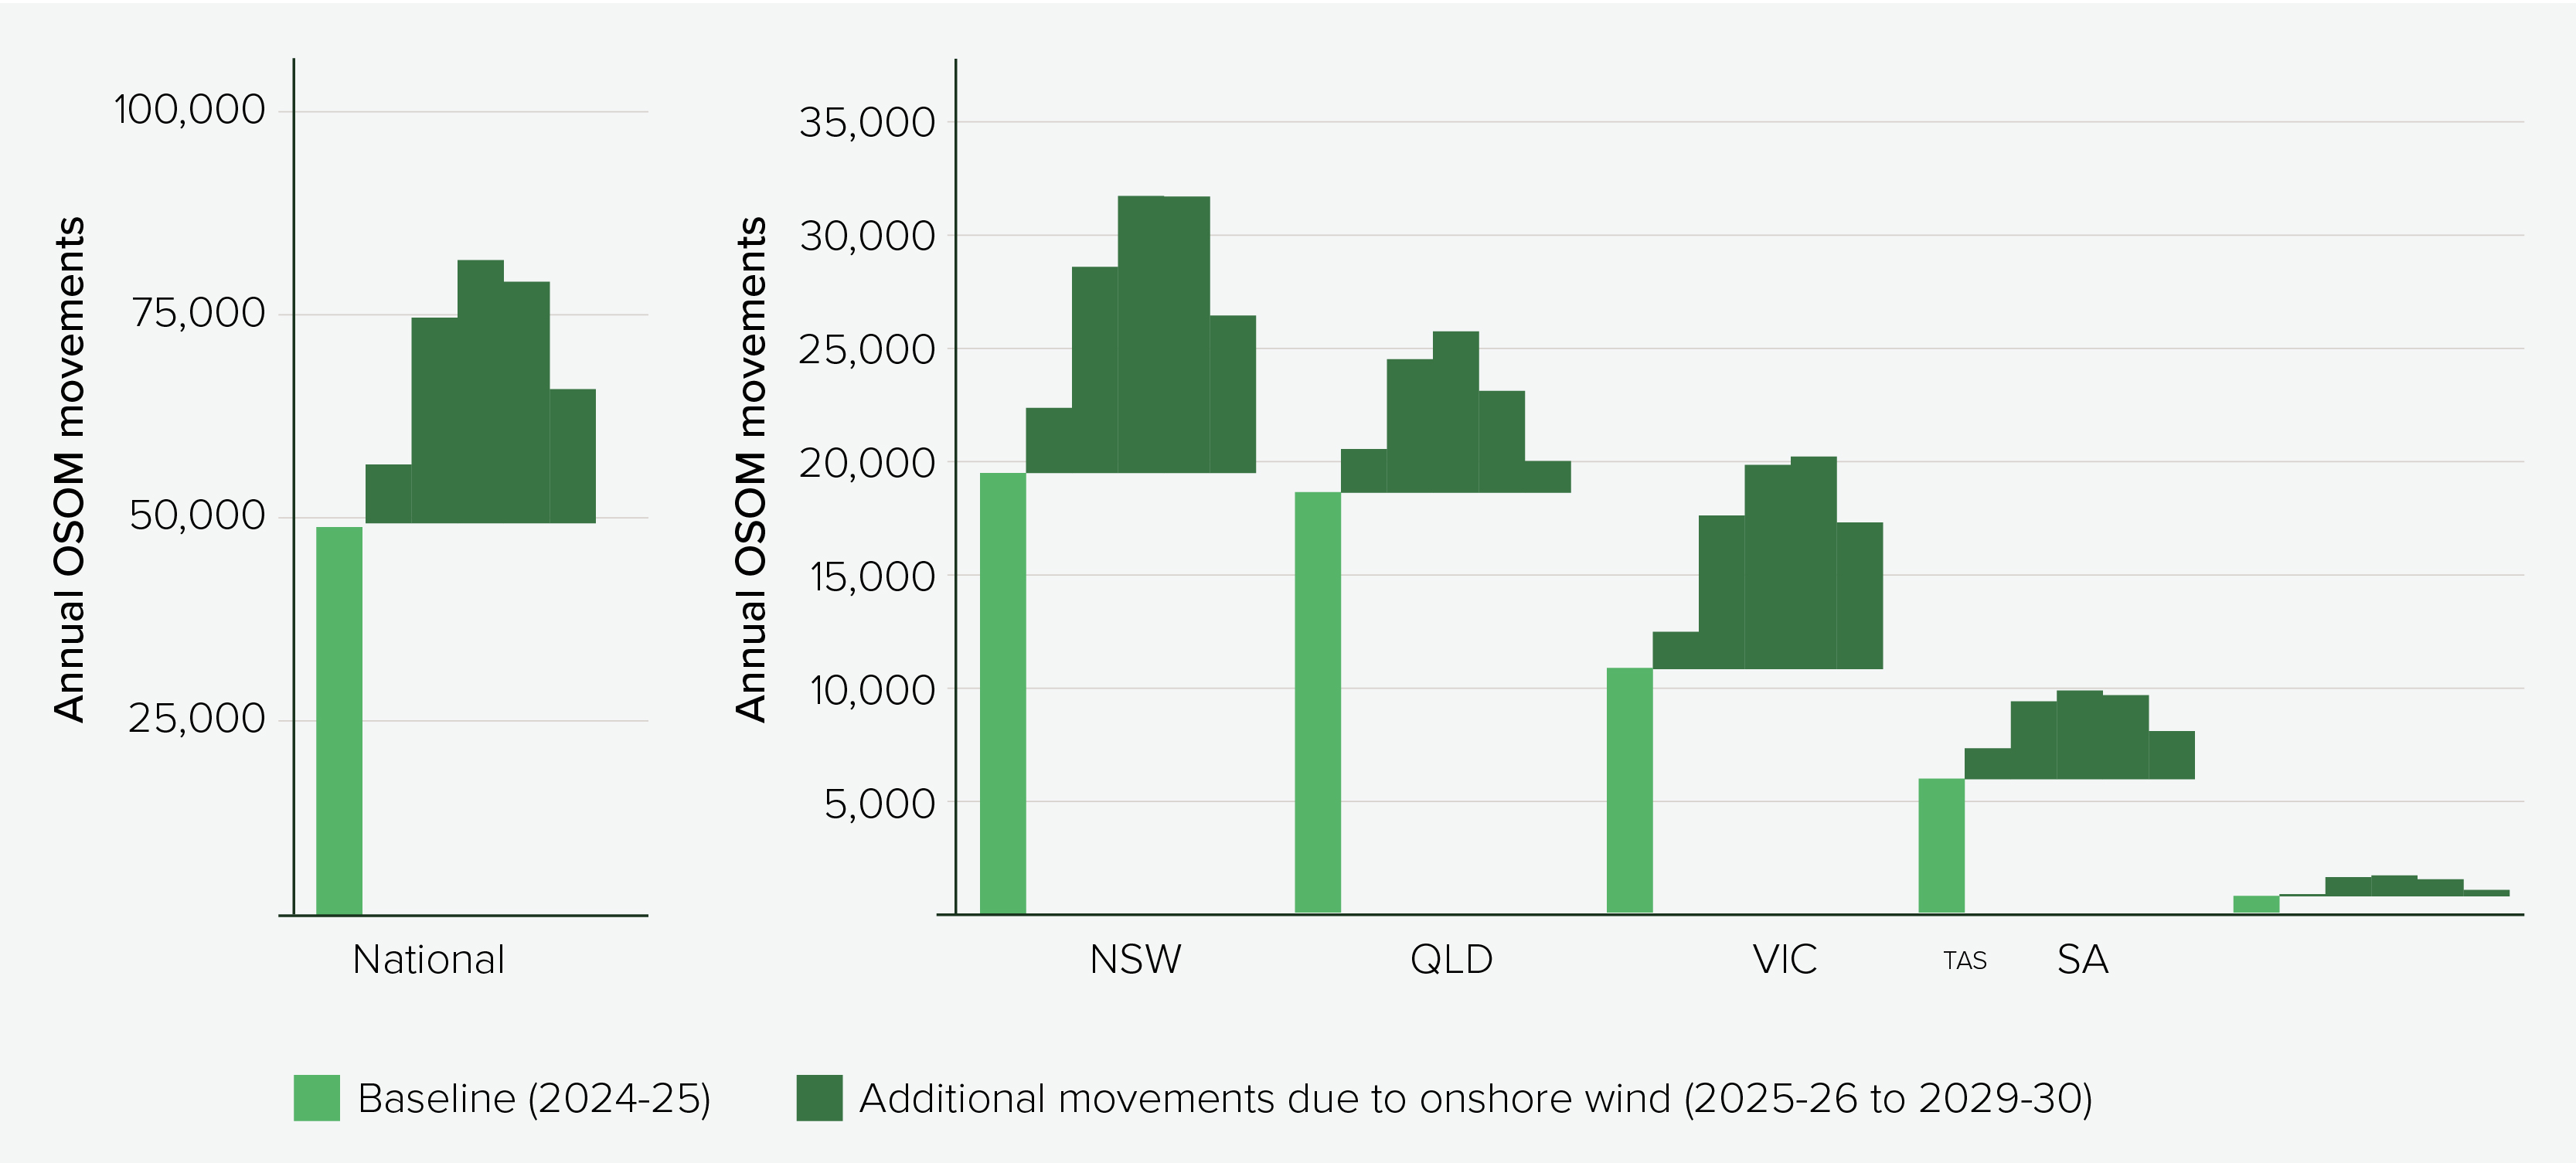
Note: Baseline OSOM movements are for the latest available year (2024–25) and derived from OSOM trips requiring permits (i.e. those that exceed pre-approved limits) and do not include OSOM moves that do not require permits.
Source: National Heavy Vehicle Regulator (2026), Infrastructure Australia (2026)
Ports are a critical part of the supply chain and will need to handle a high volume of wind turbine freight
Most turbine imports will be handled by certain critical ports
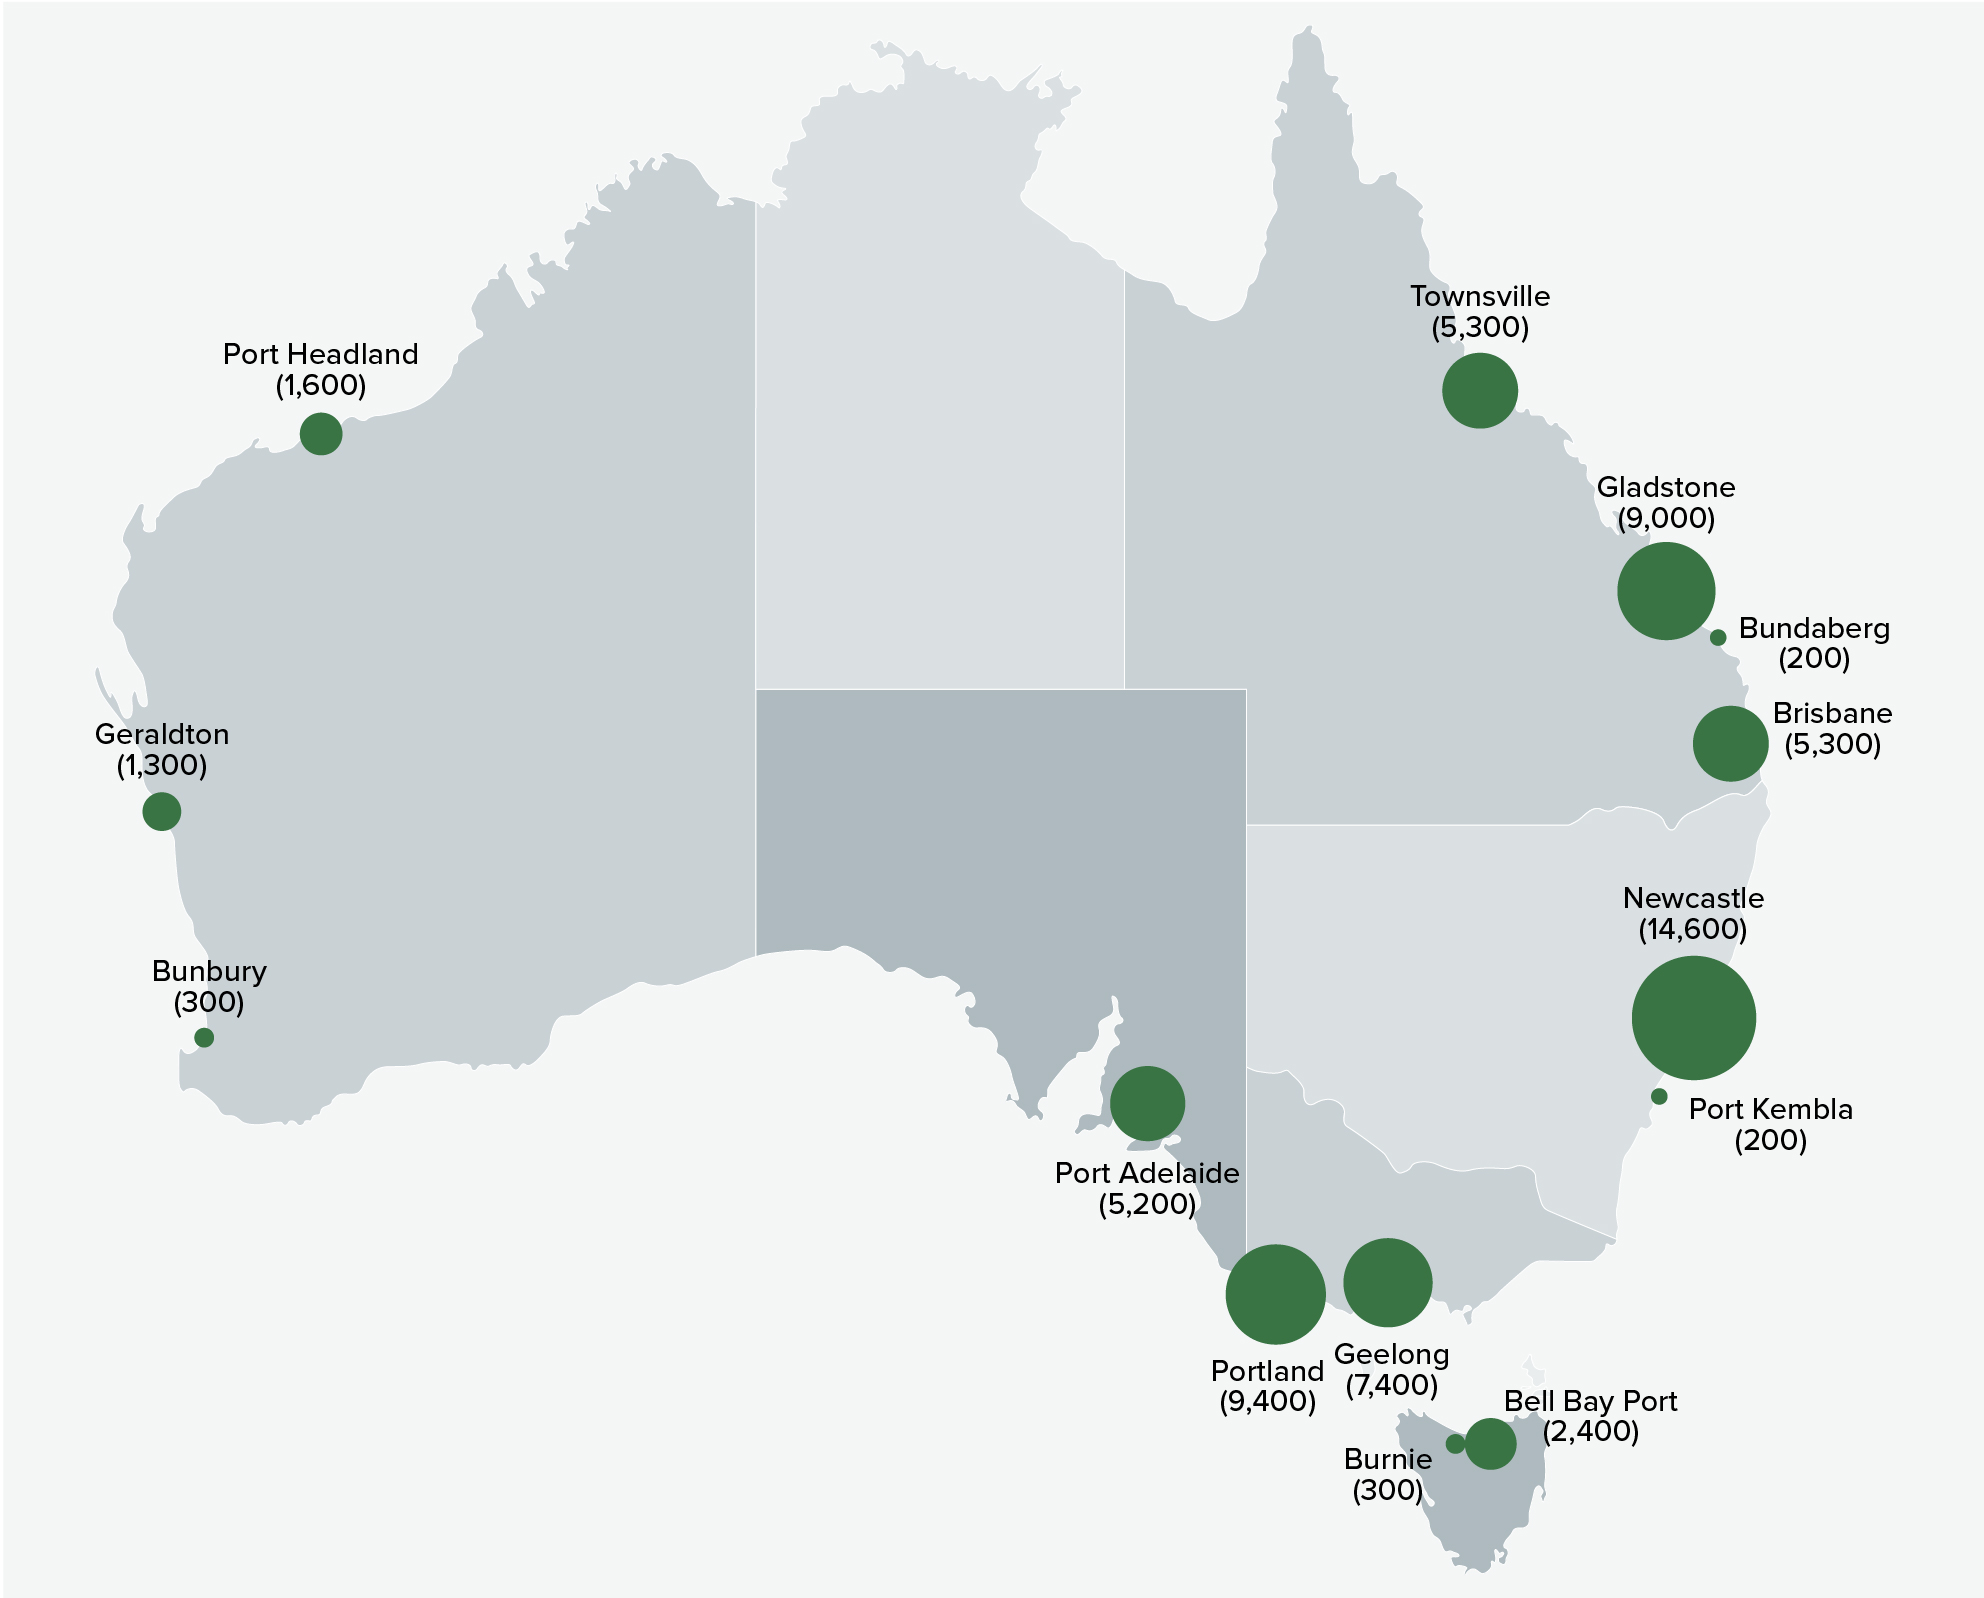
Due to their size, wind turbines require ports with sufficient infrastructure capacity. This includes offloading facilities with appropriate heavy-lift capacity, sufficient laydown areas for storage, and access roads that are passable for over-size, over-mass (OSOM) vehicles. Key ports that are best equipped to handle these components are expecting high demand in the coming years (Figure 9).
In New South Wales, the Port of Newcastle is the primary port of entry, expected to cater for most wind projects in the state. We estimate the port will handle over 14,000 wind turbine components between Q3 2025 and Q4 2030, which equates to 23% of the total for projects covered in our analysis. Port Kembla is also capable of handling some wind turbine imports, though is expected to handle much lower volumes.
In Queensland, the Port of Gladstone, Port of Brisbane and Port of Townsville are key ports and expected to handle substantial volumes of turbine imports. Gladstone is projected to handle the most, around 9,000 turbine components between Q3 2025 and Q4 2030, while Brisbane and Townsville are both expected to handle around 5,300 over that period. Other smaller Queensland ports such as Bundaberg and Mackay are currently expected to handle limited volumes but may be able to cater for additional demand.
In Victoria, the Geelong Port and Port of Portland are both expected to see high levels of demand for turbine imports, both within Victoria and for interstate projects in the South West Renewable Energy Zone (REZ) in New South Wales. Demand at Portland is projected to total 9,400 turbine components between Q3 2025 and Q4 2030, with Geelong expected to exceed 7,300 components over this period.
In South Australia, Port Adelaide is the critical port identified in our analysis, which only includes one project within the state but identifies substantial interstate demand from the South West REZ in New South Wales. In total, the port is projected to see demand in excess of 5,200 components between Q3 2025 and Q4 2030.
The use of interstate ports is expected to be significant in supporting an efficient delivery task. At the time of our analysis, for the four wind projects in the South West REZ granted access rights by the New South Wales Government, 61% of turbine components (around 7,500) were expected to come through the cross-border ports of Geelong and Adelaide. Since then, Infrastructure Australia understands some of these projects have updated delivery plans with all OSOM components expected to come from interstate ports including the Port of Portland as well as Geelong and Adelaide.
While our analysis covered fewer projects in other states and territories, other ports will remain significant for handling wind turbine imports. In Western Australia, Port Hedland, Geraldton and Bunbury are all identified ports in the analysis, while the Australian Marine Complex at Henderson is also a known port of entry for wind turbines. While Tasmania has already achieved 100 per cent self-sufficiency in renewable electricity generation, the ports of Bell Bay and Port of Burnie are both identified in our analysis.
Figure 9: Estimated wind turbine component import volumes at ports of entry for analysed projects (Q3 2025-Q4 2030)
Source: Infrastructure Australia (2026)
Peak periods of demand may exceed practical capacity at some ports
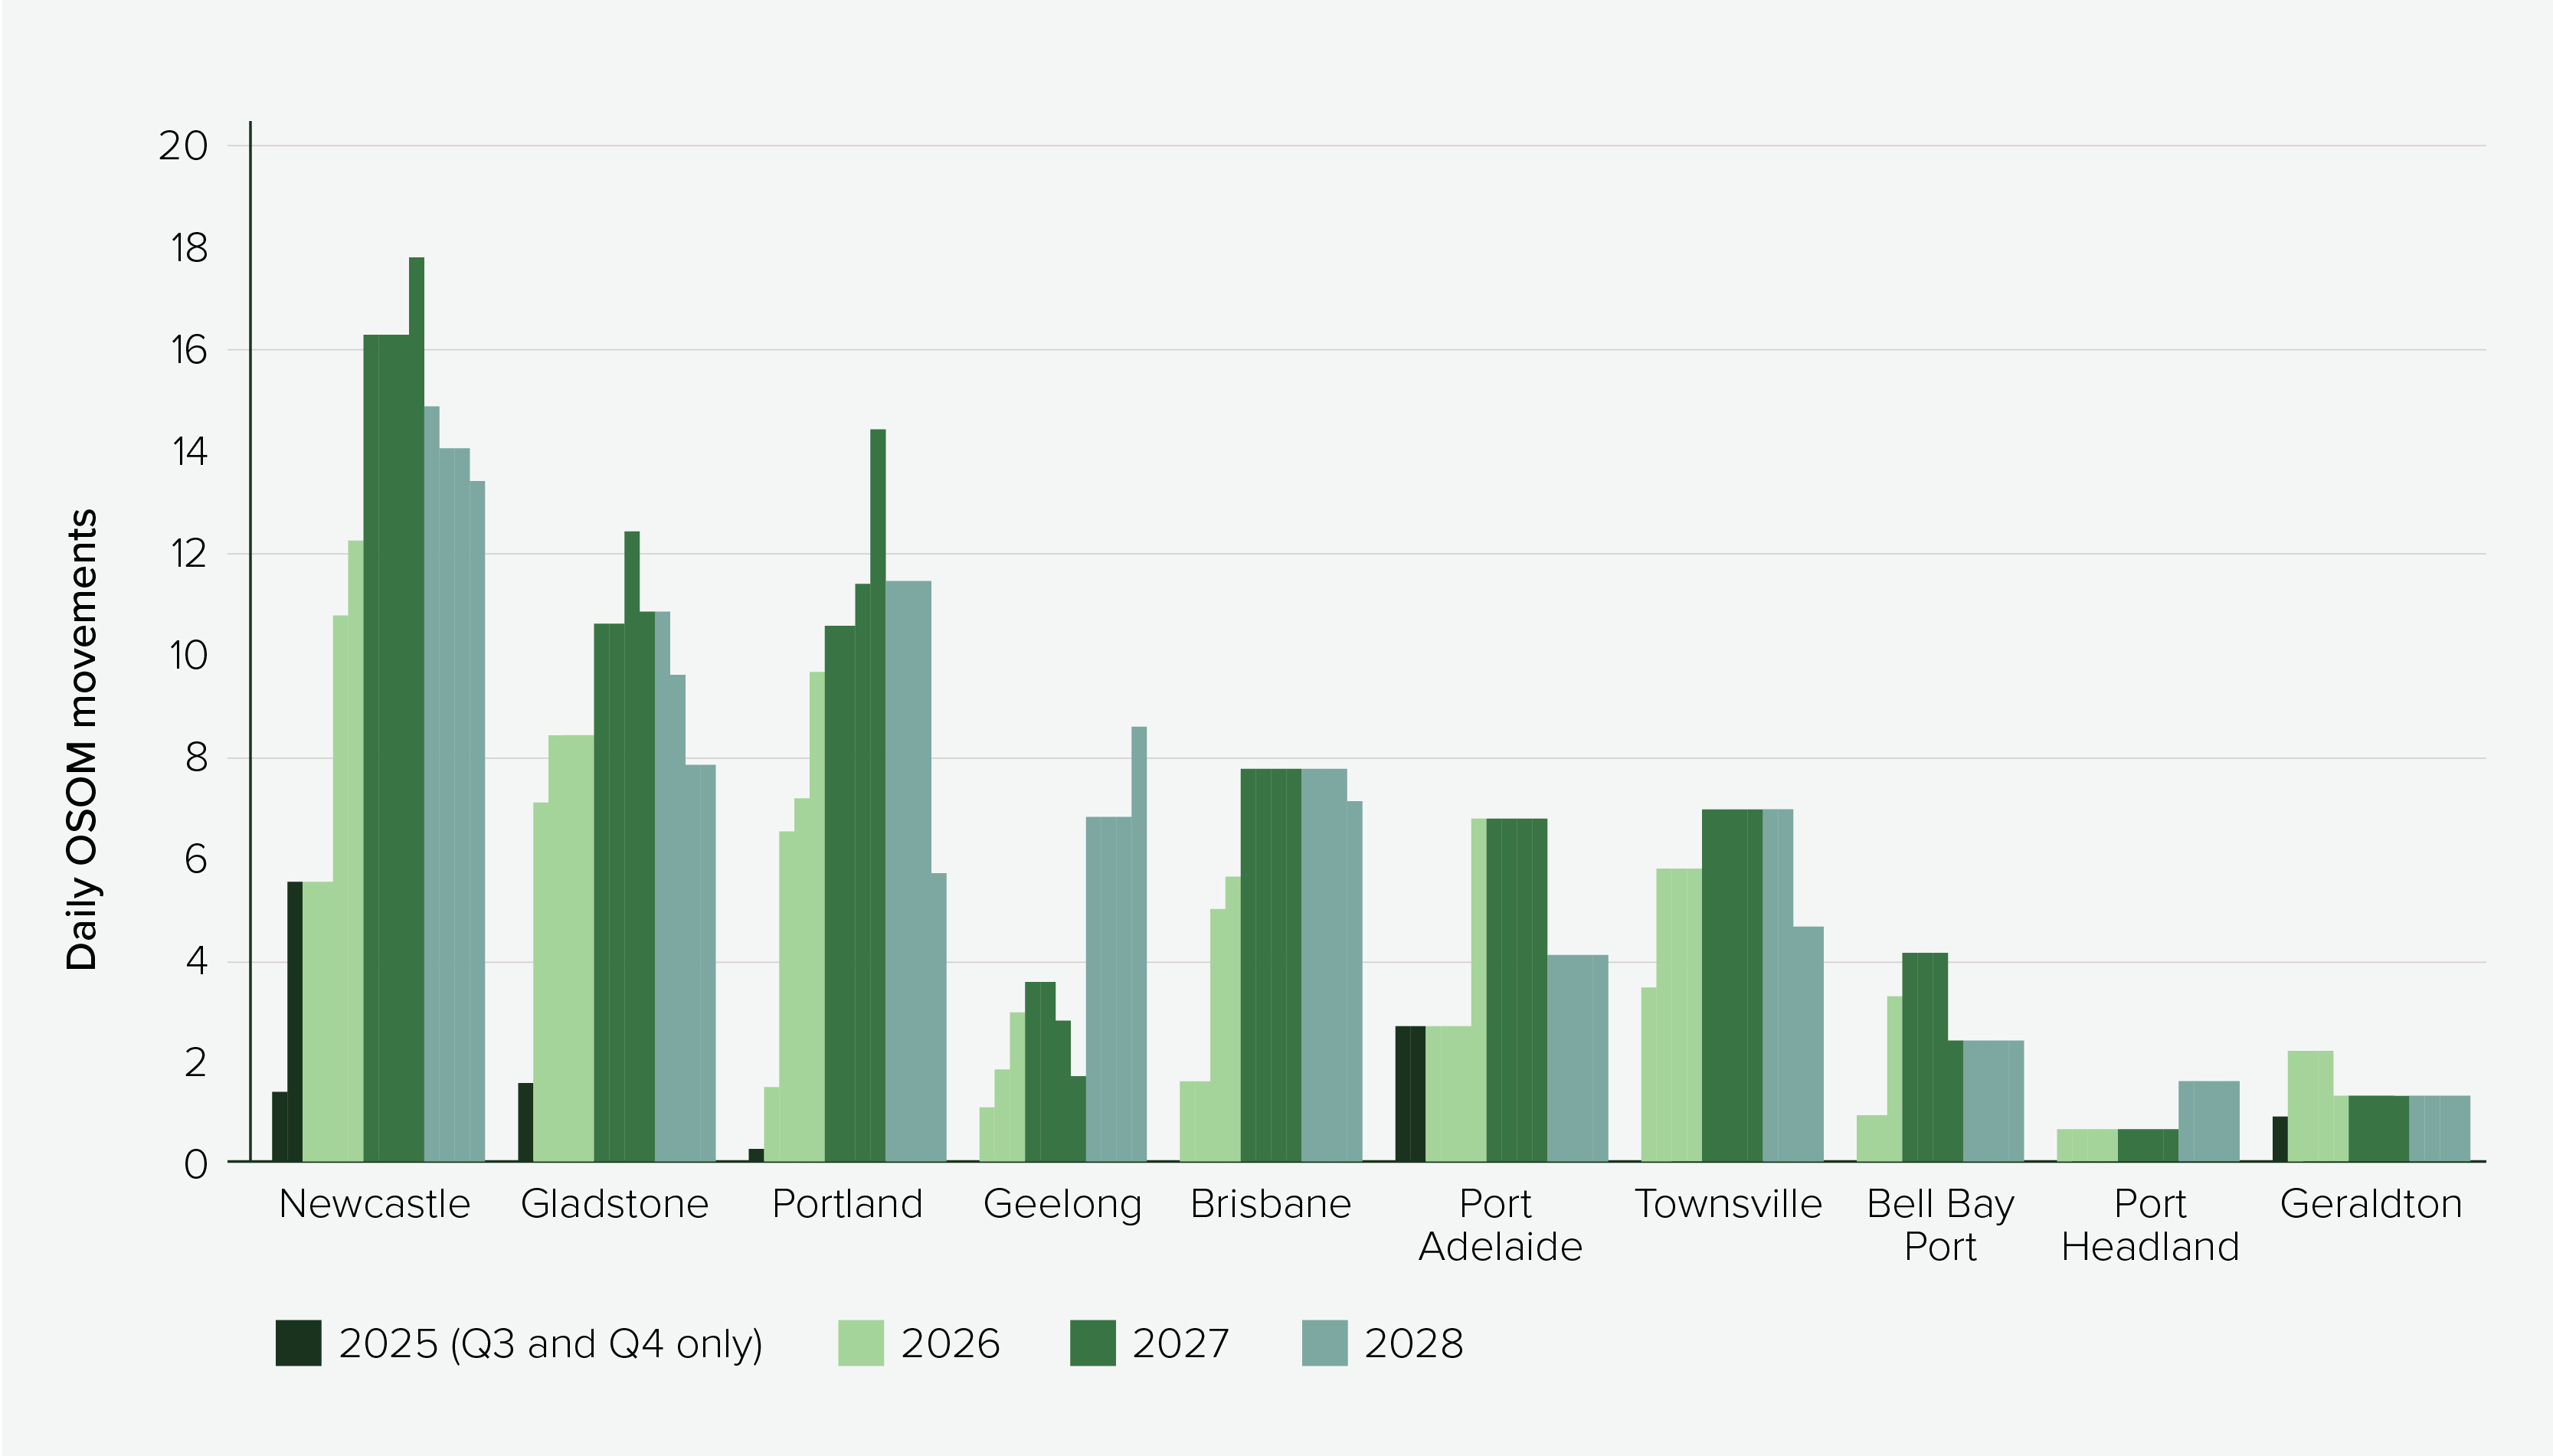
Our analysis projects a surge in unconstrained demand for onshore wind project components coming through key ports in 2027 and 2028. Figure 10 demonstrates projected daily demand for turbine imports through ports at different times, as increasing numbers of wind projects plan to enter construction with overlapping timeframes.
Our analysis shows that the daily peak is especially high for the Port of Newcastle, with unconstrained demand forecast to exceed 17 turbine component movements a day in Q4 2027.
The Port of Portland is projected to peak at more than 14 movements a day in the same quarter, while the Port of Gladstone will peak at over 12 movements a day in Q3 2027.
The ports of Brisbane and Geelong are projected to experience peak demand exceeding 7 movements a day starting from 2027 and 2028, respectively, based on our analysis.
In some cases, these projected levels of daily throughput will not be operationally feasible in practice, which could lead to bottlenecks and delays to the delivery of projects. This may require a combination of improved coordination of turbine imports, infrastructure improvements and increased use of alternative ports to mitigate the risk of delays. This is discussed further in the next chapter.
These peaks are based on near-term demand from analysed projects in the pipeline over the five-year outlook. As noted in the first chapter of this report, demand for onshore wind construction will see a pronounced uplift in onshore wind projects in this period but also be sustained over the longer term. So, while the demand presented below shows peaks in 2027 and 2028 and appears to taper off, more projects are expected to enter the pipeline in future years that are not currently captured in the five-year outlook.
Figure 10: Projected daily demand for import of wind turbine components into ports
Source: Infrastructure Australia (2026)
Wind turbine freight will rely on national road networks to transport components from ports to project sites
Nearly two thirds of the wind turbine freight task will be on national freight routes across the country
The very large dimensions of wind turbine components mean it is typically only practical to transport most of this freight by road, using specialised vehicle configurations.
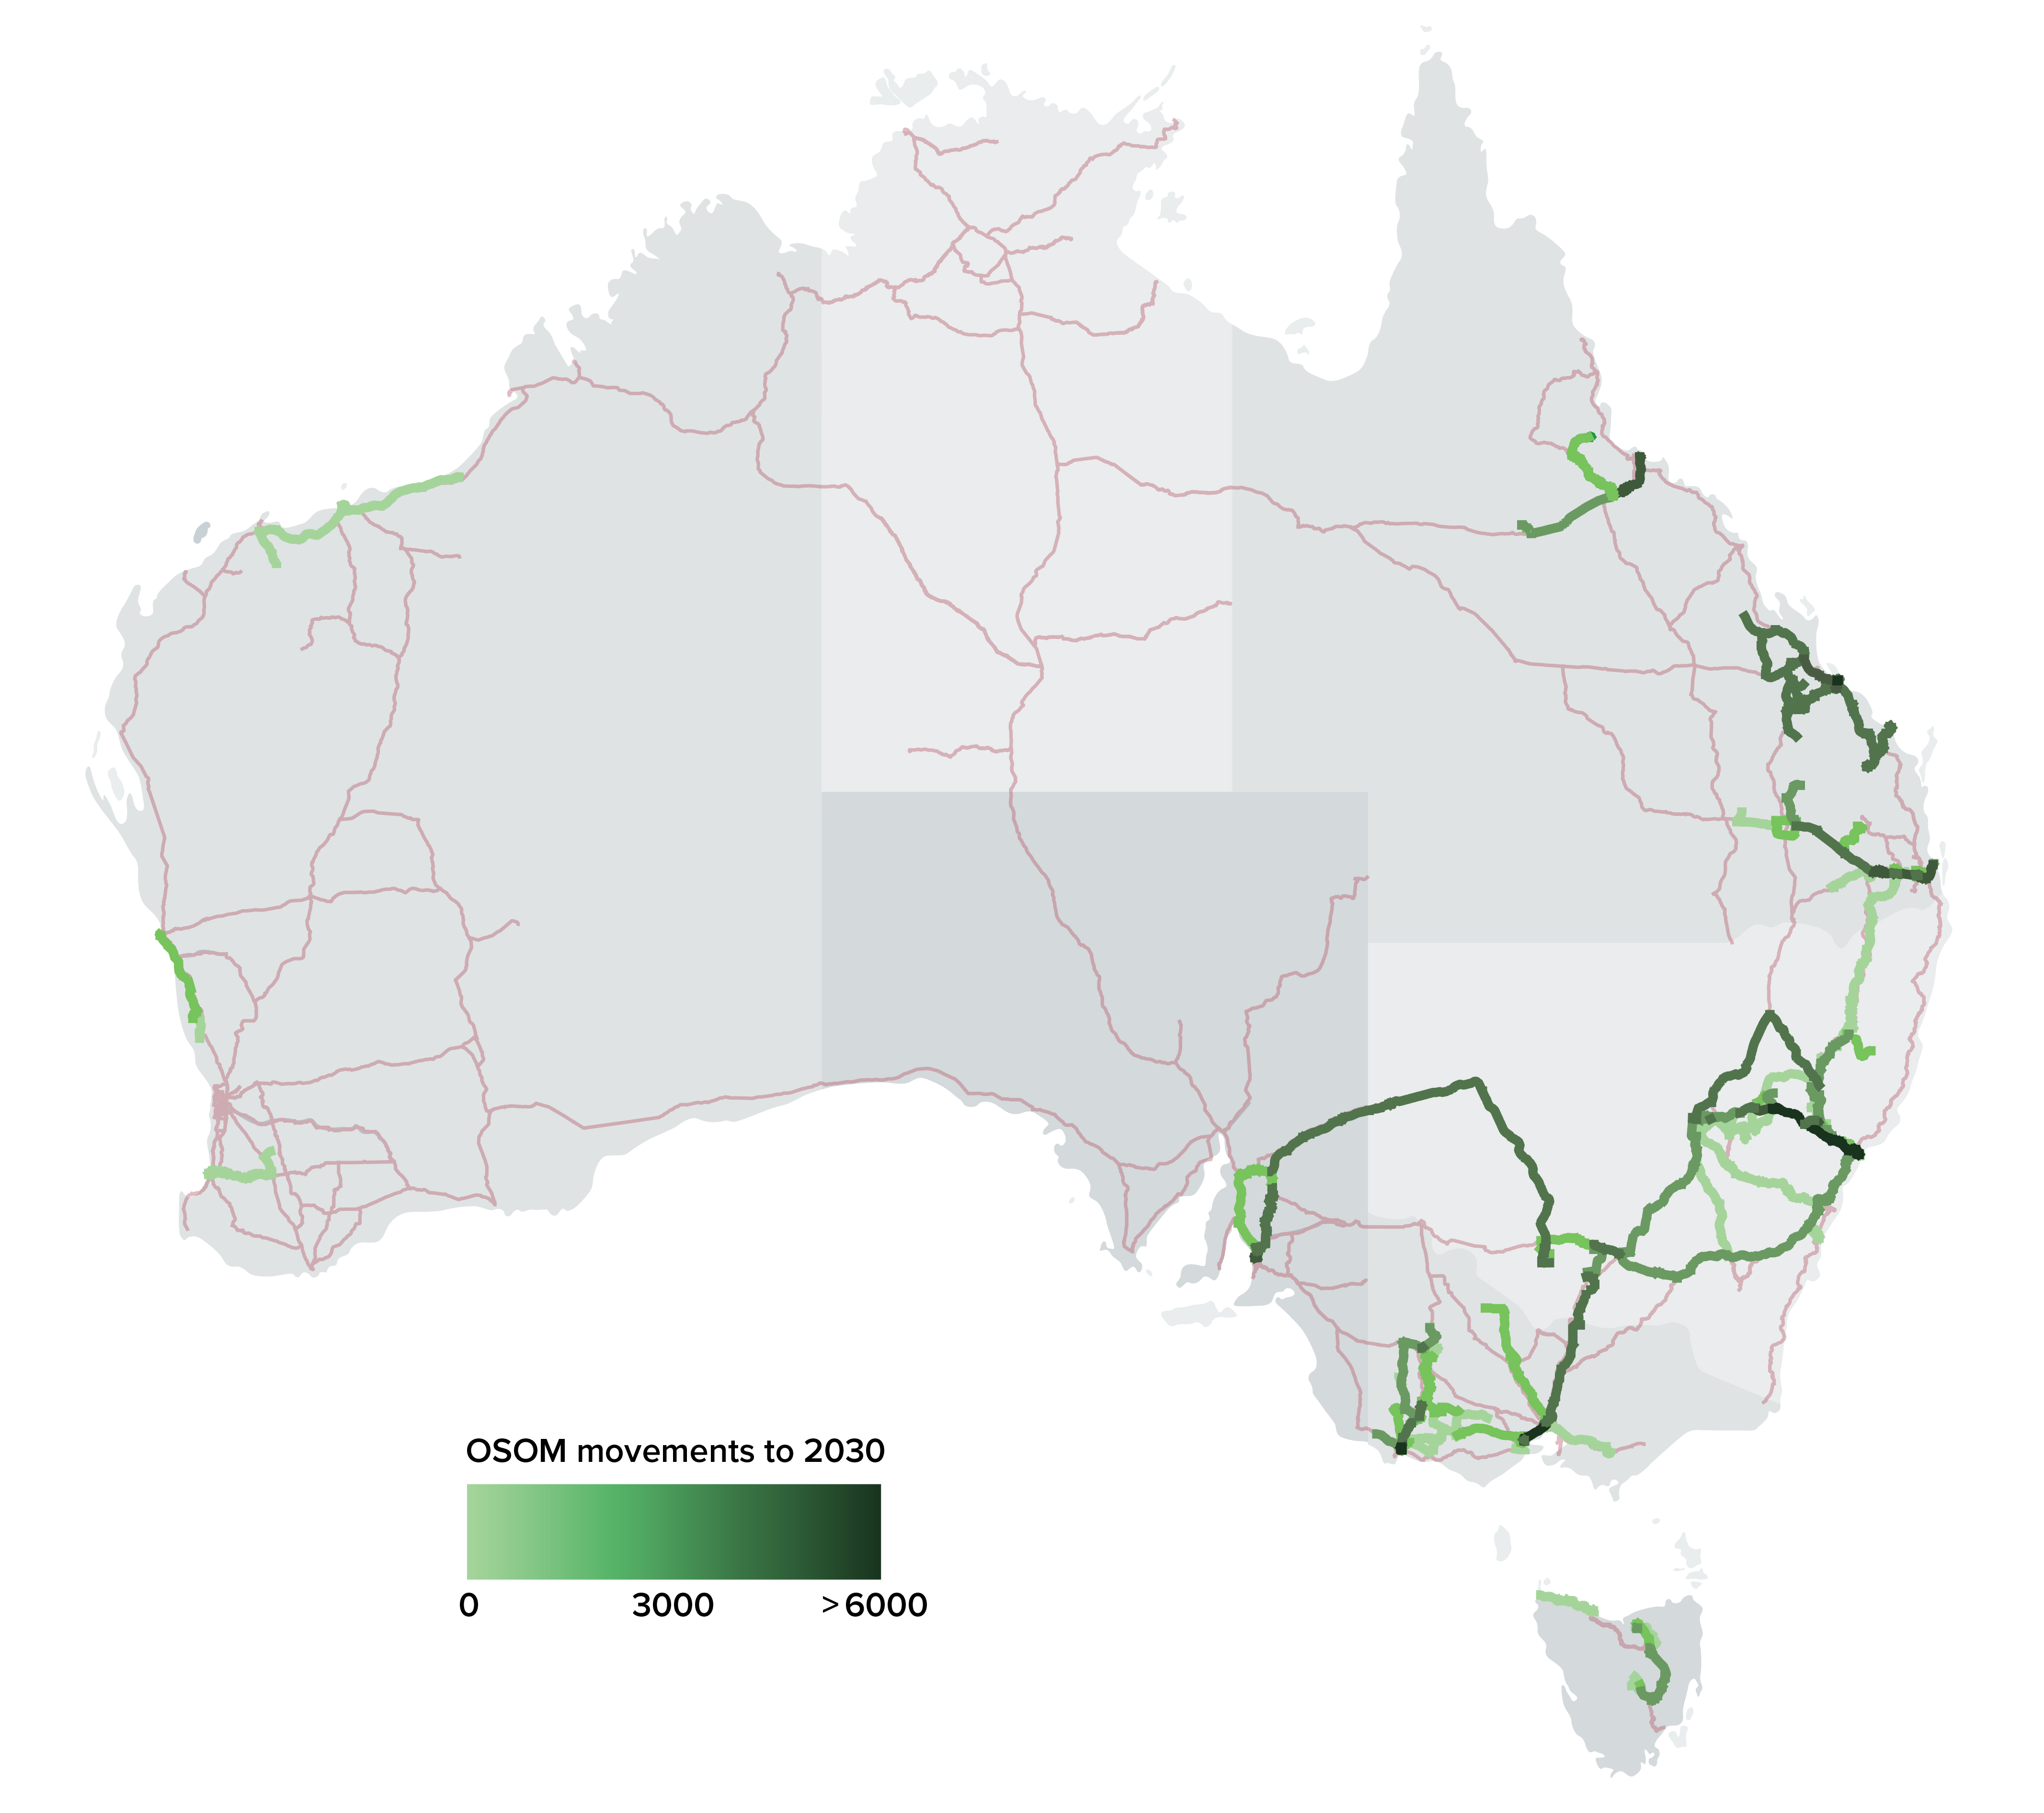
By analysing the delivery routes that project proponents plan to use for transporting turbine components from ports to project sites and the expected levels of demand on these routes, we have identified the primary road corridors that will support the roll-out of onshore wind infrastructure (Figure 11). This illustrates a national network of freight corridors that will be critical for the delivery task.
Our analysis shows a large proportion of over-size, over-mass (OSOM) vehicle movements will rely on sections of the designated National Land Transport Network and national key freight route networks.24,25
- Of 7,400 km total length of roads identified as primary delivery routes for turbines in our analysis, 60% of these routes are on national networks.
- Based on our analysis of demand, we estimate that 65% of vehicle kilometres travelled for these wind turbine OSOM movements will occur on these national road routes.
Figure 11: Road transport routes and demand for wind turbine delivery (Q3 2025–Q4 2030)
Source: Infrastructure Australia (2026)
Delivery of onshore wind in the National Electricity Market will depend heavily on eight critical freight corridors in the four mainland states
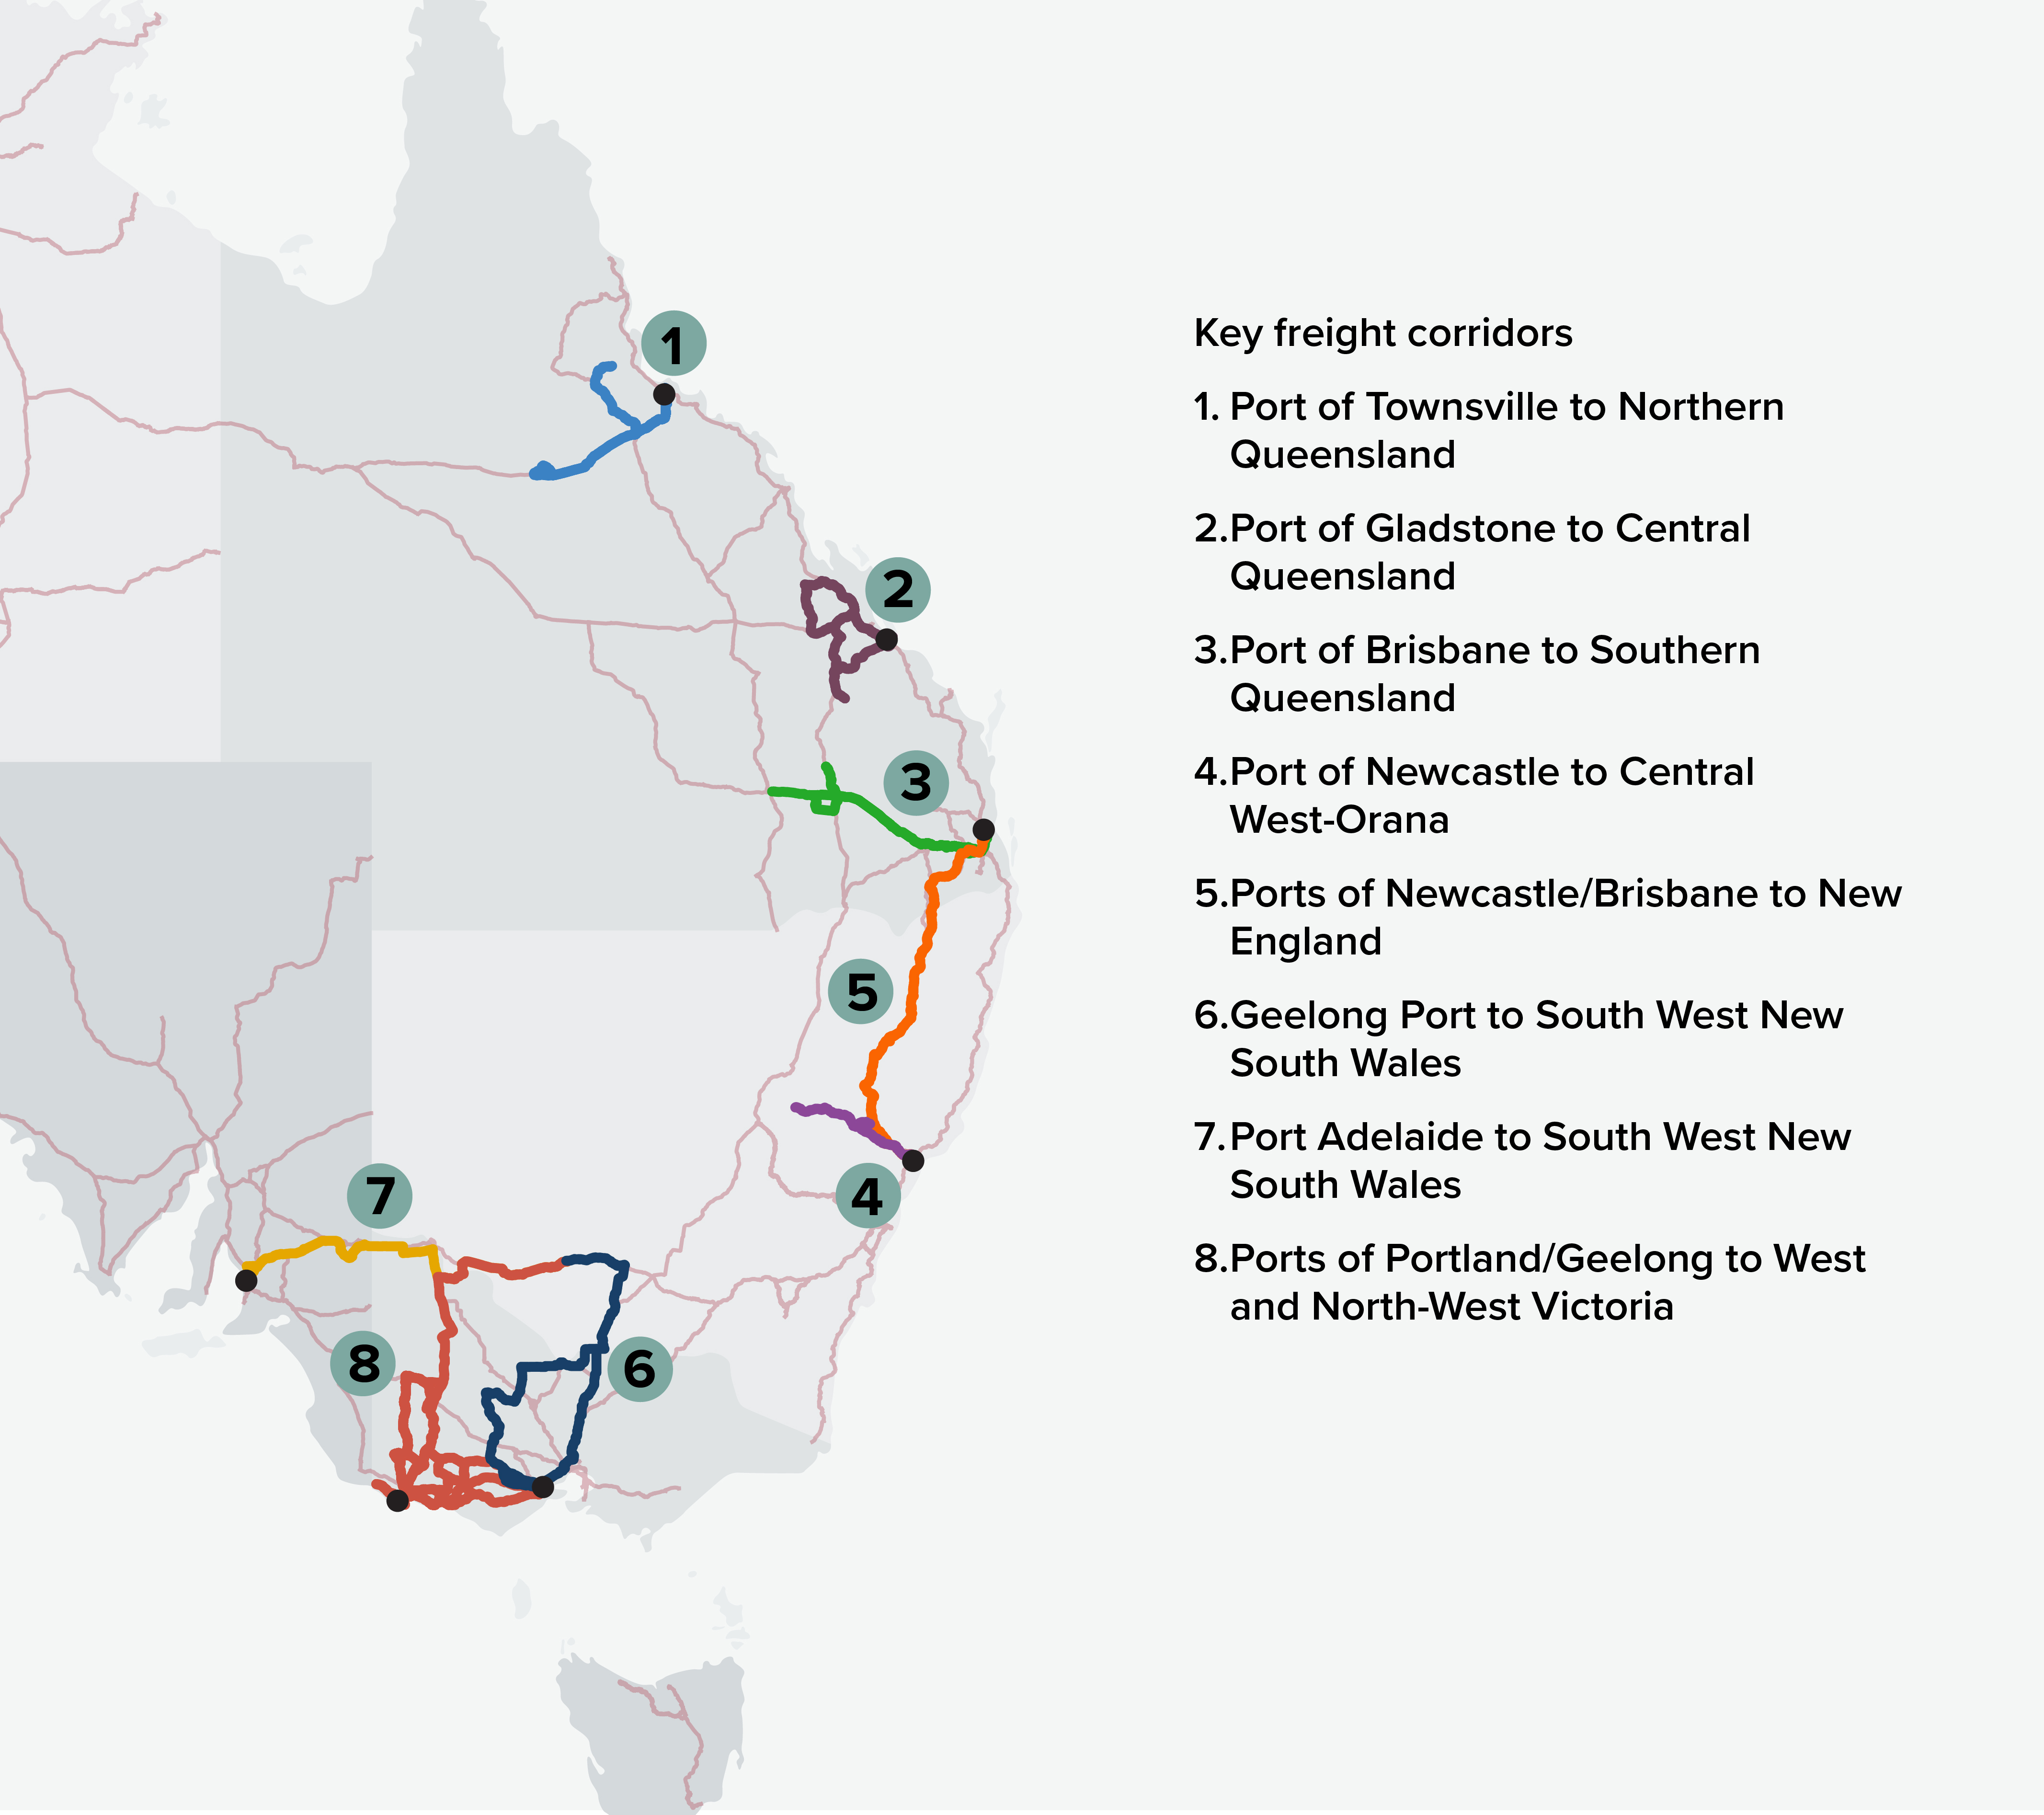
We have identified eight major road corridors from ports to project sites that will be essential to delivering onshore wind projects in Australia’s National Electricity Market, across the mainland states of New South Wales, Queensland, South Australia and Victoria (Figure 12). These corridors show up most strongly in the analysis of ports of entry, delivery routes and demand volumes for wind turbine components, based on the projects included in our analysis.
This includes several cross-border corridors identified for transporting wind turbines from ports to project locations in other jurisdictions. These routes highlight where interstate ports are closer to projects and provide a more cost-effective transport route or offer a potential alternative entry port for projects in certain regions where primary ports may face capacity limits. The role of inter-state ports is especially relevant for wind development in regions of New South Wales where ports in Victoria, South Australia and Queensland will act as primary or possible alternative ports of entry.
These corridors are described in more detail below. Infrastructure Australia has also assessed specific infrastructure needs and constraints on these corridors, discussed later in this report.
Figure 12: Key corridors for OSOM movements in mainland National Electricity Market states
Source: Infrastructure Australia (2026)
1. Townsville to Northern Queensland
Four projects were analysed in Northern Queensland, with a total generation capacity of 3.0 GW. Our analysis shows these projects to require almost 5,300 OSOM movements by 2030, with a peak of up to 7 movements per day from Q1 2027 to Q2 2028.
Projects in Northern Queensland are expected to use the Port of Townsville. Cairns may also be a possible port of entry but was not nominated by projects included in our analysis. OSOM vehicle movements to transport wind turbines are expected to travel via Southern Port Road to Flinders Highway. Deliveries to the south continue on Flinders Highway, while projects to the north would depart Flinders Highway and travel on Gregory Development Road, travelling through Charters Towers or via a suitable bypass route to avoid the town.
2. Gladstone to Central Queensland
Nine projects were analysed in Central Queensland, with a total generation capacity of up to 4.85 GW. Our analysis shows these projects to require over 9,000 OSOM movements by 2030, with a peak of over 12 movements per day in Q3 2027.
Projects in Central Queensland are expected to use the Port of Gladstone. The smaller ports of Bundaberg and Mackay are also possible ports of entry, though only Bundaberg was nominated as a potential port by one project in our analysis.
There is no single common corridor for OSOM delivery routes from the port of Gladstone, and multiple freight routes from the port service multiple delivery locations, such as Banana and Callide to the south and Isaac to the north. Routes vary based on the delivery location and the types of turbine component according to its dimensions. Critical road corridors include Gladstone-Mt Larcom Road, the Bruce Highway, Dawson Highway, Capricorn Highway and Leichhardt Highway.
3. Brisbane to Southern Queensland
Four projects were analysed in Southern Queensland, with a total generation capacity of up to 2.5 GW by 2030. Our analysis shows these projects require over 5,300 OSOM movements by 2030, with a peak of over 7 movements a day from Q1 2027 to Q3 2028.
The Port of Brisbane is identified as the port of entry for projects in Southern Queensland. OSOM movements are expected to exit Port of Brisbane via Port Drive, Port of Brisbane Motorway and head south on Gateway Motorway, travel west on Logan Motorway, Ipswich Motorway and west on the Warrego Highway to Miles. From there deliveries continue west on the Warrego Highway or head north towards Wandoan on the Leichhardt Highway.
4. Newcastle to Central West-Orana, New South Wales
Five projects were analysed in the Central West-Orana REZ, with a total generation capacity of 3.7 GW by 2030. This includes three projects on the National Renewable Energy Priority List, which alone are set to deliver nearly 3 GW of wind generation capacity. Our analysis shows these projects require over 6,600 OSOM movements by 2030, with a peak of over 8 movements a day from Q4 2026 to Q4 2027. Sections of the OSOM delivery corridor for the Central West-Orana REZ that are shared with the New England REZ are projected to see very high demand, with around 10,000–14,000 OSOM movements by 2030.
The Port of Newcastle is the primary port of entry for projects in central regions of New South Wales, including the Central West-Orana REZ. OSOM movements from the Port of Newcastle to this REZ use a single exit onto Selwyn Road and use Industrial Drive to access the Pacific Highway.
Routes for wind turbine OSOM movements are expected to go from the Pacific Highway via John Renshaw Drive, the Hunter Expressway and the Golden Highway to Dubbo. The route includes a diversion for height-constrained OSOM loads such as tower sections to avoid constraints at Denman.
5. Newcastle and Brisbane to New England, New South Wales
The New England REZ is intended to provide 8 GW of renewable generation by 2037.26 Four projects in New England REZ and two projects in the Hunter-Central Coast REZ were analysed, with a total generation capacity of up to 1.7 GW by 2030. We project that these projects require around 3,700 OSOM movements between now and Q4 2030, with a peak of around 6 movements a day in Q4 2027. Demand is expected to increase further as wind development in the New England REZ ramps up between 2030 and 2037.
The Port of Newcastle is the primary port of entry for projects in these REZs. OSOM movements from the Port of Newcastle to New England follow sections of the Newcastle to Central West-Orana REZ corridor from Newcastle to Denman via the Golden Highway then travel north to Muswellbrook. Alternatively, OSOM movements may use the New England Highway via Singleton using the Singleton Bypass once construction is complete, which is expected in late 2026.27 From Muswellbrook, OSOM movements travel north via the New England Highway, including a diversion around the centre of Tamworth using the local roads of Whitehouse Lane, Marsden Park Road, O’Briens Lane and Nundle Road to Nemingha, to continue north on the New England Highway.
The Port of Brisbane may provide a potential alternative port of entry for projects in northern regions of New South Wales. The viability of this route to support OSOM movements of wind turbine freight would need further assessment, with potential challenges including capacity to accommodate additional OSOM movements at the Port of Brisbane as well as steep terrain and narrow sections on the road corridor. If viable, route planning information from project proponents indicates that wind turbine components from Brisbane would be expected to travel from the Port to New South Wales on the Cunningham Highway and New England Highway or using local roads via Cullendore. These routes converge at Tenterfield to continue south via the New England Highway.
6 and 7. Corridors from Geelong and Adelaide to South West, New South Wales
Four wind projects have been granted access rights by the New South Wales Government in the South West REZ, with rights to deliver 3.56 GW in total generation capacity by 2030,28 though the full potential capacity of these projects is up to 4.8 GW. To deliver this full aspirational capacity, these projects would require over 12,000 OSOM movements by Q4 2030, with a peak of over 13 movements a day from Q1 2028 to Q2 2029. There is also a significant pipeline of other wind projects in active development in the South West region of New South Wales, not included in our analysis, which could further increase demand.
Wind turbine deliveries to the South West REZ are expected to be transported from multiple ports of entry via Geelong in Victoria and Adelaide in South Australia. Routes from Geelong to the South West REZ, which are also expected to support delivery of wind projects within Victoria, involve two corridors for different types of turbine components:
- An easterly route for turbine blades exits Geelong Port to the south, looping north via Waurn Ponds, then towards Melbourne on the Princes Freeway. From Melbourne, the route travels north using the Hume Freeway and Goulburn Valley Freeway to cross the Murray River into New South Wales at Tocumwal, continuing north on the Newell Highway to Jerilderie and Darlington Point, then west on the Sturt Highway to Hay.
- An alternative westerly route from Geelong is required for components such as tower sections due to the number of height constraints on the easterly route. The alternative route travels west from Geelong on either Hamilton Highway or Midland Highway, using a combination of state and local roads via Skipton and Beaufort, Lexton and Bridgewater on Loddon, and then from Serpentine north and east to Mitiamo, before heading east on Echuca-Mitiamo Rd and the Murray Valley Highway to cross the Murray River into NSW at Tocumwal.
Some proponents of projects in our analysis investigated routes from Adelaide to the South West REZ using the Barrier Highway via Broken Hill and the Cobb Highway, mainly due to fewer height and width constraints for OSOM vehicles. However, this route still faces challenges including narrow road corridors, asset condition and flooding hazards. The Sturt Highway provides the most direct, efficient route, if infrastructure constraints on this corridor are addressed, reducing the transport distance for each turbine movement from over 1,000 km via Broken Hill to less than 700km.
The Sturt Highway route has two short diversions from the main corridor to avoid major pinch points and towns. One is a detour via Loxton on Kingston Road, Bookpurnong Road and Stanitzki Road to re-join the Sturt Highway near Pike River. This avoids travel through Kingston on Murray and Renmark, including a width-restricted bridge at Kingston and height and width constraints at Paringa Bridge (4.9m height clearance, 3.0m width restriction).
The other is a detour via Calder Highway and Hattah-Robinvale Road to avoid travel through Mildura, crossing from Victoria into New South Wales at Robinvale to re-join the Sturt Highway east of Euston.
8. Portland and Geelong to West and North-West Victoria
12 projects across western Victoria were included in our analysis, which are expected to deliver 5.5 GW of renewable generation capacity by 2030. These projects are estimated to require over 12,000 OSOM movements by 2030, with analysis showing a peak of over 16 movements a day in Q4 2027.
The ports of Portland and Geelong are key ports of entry for these projects. Freight routes for transporting wind turbine components from these ports service multiple delivery locations in the west and north-west of Victoria, with few common routes.
Deliveries from Geelong are expected to exit south from the port and travel westward using the Midland Highway, Hamilton Highway or Princes Highway. From the Port of Portland, key road corridors for OSOM movements include the Henty Highway, Princes Highway and Western Highway, while many regional arterial and local roads are also used to reach project sites including the Hamilton Highway and Glenelg Highway.
The Princes Highway may also be an important east-west enabling corridor to support onshore wind development in eastern parts of the state, such as the Gippsland REZ.
Data from proponent plans analysed by Infrastructure Australia indicates that Portland will primarily serve wind projects within Victoria. More recent stakeholder engagement indicates that some interstate projects such as those in the South West of New South Wales also now plan to use the Port of Portland as a port of entry.
Challenges for delivering wind turbine freight
Delivering a single wind turbine typically requires between 12–14 movements of very large, imported turbine components using specialised equipment, each of which must navigate complex infrastructure, regulatory and operational requirements, with the growing size of turbines further increasing delivery complexity.
The expected high volumes of these complex freight movements will put pressure on the capacity of ports and road networks, regulatory systems, logistics providers and communities, and elevate risks of increased costs and delays to deliver wind projects.
More coordinated national action is needed on regulatory reform, infrastructure planning and investment to optimise the delivery environment, reduce duplication and enable a more efficient energy transition as renewable energy construction intensifies.
Onshore wind projects involve a complex and unique freight and logistics challenge that presents risks to efficient delivery
Enabling infrastructure
Port and road infrastructure
Australia relies heavily on importing components for wind projects through ports and transporting these on national, state and local road networks. This is especially true for over-size, over-mass (OSOM) components such as wind turbines, large transformers and synchronous condensers.29,30,31
Modern turbines can have blades up to 100m long, tower sections with diameters exceeding 6m, and other components that can weigh over 200 tonnes.
The capacity of ports to handle these components are influenced by the availability of berths, their ability to accommodate larger vehicles, heavy-lift offloading capability, and the availability of laydown areas to accommodate extended storage requirements across multiple projects. Ports also need to be equipped to meet biosecurity and customs inspection requirements for imported wind turbine components.
Throughput of components at ports is also constrained by how quickly components can be unloaded from vessels, transferred onto vehicles, and other restrictions arising from curfews, availability of logistic resources and restrictions on permitted movements per day. Projects can also store wind turbine components at ports for extended periods until project sites are ready for assembly.32,33
Transporting a single wind turbine from port to project site typically requires around 12–14 OSOM vehicle movements using specialised trailers and navigating road corridors, intersections and bridge structures not designed to support these movements. Various physical constraints can either prevent the ability to move OSOM components on roads or restrict the speed, efficiency or safety of delivery. Addressing these constraints often requires enabling infrastructure works and in some cases property acquisition that increase project costs and impact project schedules due to the time needed for planning, approvals and delivery of any enabling works required.
The scale and pace of uplift in onshore wind infrastructure is placing increased demands on ports and road networks, which already face capacity and resilience pressures from a growing national freight task and disruptions from climate-related and other hazards.34,35,36 Without action, freight infrastructure faces bottlenecks that are likely to impact project schedules as activity ramps up.
The infrastructure challenge for wind turbine freight is further intensified by the growing size of turbines. This increases the dimensions of individual components, such as blades and tower sections, which are more constrained by existing roads and structures and create additional infrastructure impacts and costs to enable their movement from ports to project sites.37,38
Physical constraints on wind turbine freight movements
Multiple physical infrastructure constraints on road corridors, at intersections and bridges can restrict OSOM movements and require costly modifications or use of detours. These include:
Width constraints arising from structures such as bridges, culverts or floodways, narrow or obstructed turns at intersections and roundabouts or road corridor geometry such as tight curves or S-bends that restrict manoeuvrability. These may need infrastructure modifications such as pavement widening, intersection re-configuration or temporary removal of roadside features, such as fencing, signage or traffic lights.
Height constraints arising due to limited vertical clearances from road or rail overpass bridges or overhead infrastructure such as gantries, traffic light masts, or utility lines. These can require re-grading of roads under bridges, raising of bridge structures and temporary or permanent raising or reconfiguration of overhead obstructions.
Mass constraints arising due to limits on load-bearing capacity of structures such as bridges and floodways, which may restrict the weight of vehicles and loads able to use these or not be sufficient to cater for a higher volume or intensity of heavier loads. Structures can require strengthening works or in some cases full replacement.
Road surface constraints arising where unsealed roads or sealed roads with pavement structures not designed to withstand regular OSOM traffic can restrict access or require upgrades to support repeated heavy vehicle movements.
Freight network interfaces
Energy projects in some jurisdictions will depend on inter-state freight networks to deliver. The South West region of New South Wales is one example, where projects are expected to rely on both ports and freight corridors in South Australia and Victoria as well as New South Wales.
Fragmented access processes and coordination across jurisdictions and infrastructure owners can make heavy vehicle access more complex and time consuming.39 This requires collaboration and effective coordination to plan infrastructure and manage logistics across borders.
Traversing freight or passenger rail networks presents additional costs and complex coordination issues for OSOM movements. Failure to have all the elements in place at the right time means slots for crossing rail lines are missed, causing delays and added costs. Level crossings may also require access costs and/or infrastructure works to enable OSOM movements on critical transport corridors.
Overhead utilities such as electricity distribution lines that cross road networks also present an infrastructure constraint on certain OSOM loads. This increases the complexity of OSOM movements and requires individual developers to coordinate with electricity network providers to lift lines, which can result in further time and cost impacts for projects.40
Other enabling infrastructure needs
Onshore wind projects require a range of other enabling infrastructure, including reliable water, waste, power and social infrastructure across their lifecycle for construction, operation and decommissioning. Workforces create demand for accommodation, utilities and community services in regional areas where capacity is often limited, with communities expressing concerns about cumulative impacts such as housing shortages where multiple developments coincide.41,42
Although local solutions are emerging, efforts remain fragmented. Developers often need to work individually to deliver worker accommodation, engage councils on local road access and work with utility providers to address issues such as lack of telecommunications network capacity in remote areas. More coordinated planning and investment in common enabling infrastructure needs in areas with significant development activity could improve the efficiency of the clean energy rollout and capture opportunities for lasting legacy benefits for communities that might otherwise be missed.43
Practical limits on transport network capacity could delay delivery
Several factors limit the practical capacity of ports and corridors to transport wind turbine components. Operational restrictions, such as curfew arrangements, can restrict OSOM movements out of ports to certain time windows or limit daily numbers of movements. Physical infrastructure constraints can increase the time, and therefore cost, for trips to and from project sites by forcing OSOM vehicles to detour around restrictions and restricting the speed these vehicles can safely travel. Availability of skilled drivers and vehicle fleet, and shortages of pilots and escorts, to conduct moves is another factor, which is also impacted by how efficiently trips can be completed.
The ports and road corridor capacity is difficult to determine with precision. Based on stakeholder engagement, the practical capacity of supply chains to transport OSOM freight is typically a throughput of five to ten daily movements on a corridor. This capacity must cater for needs across the economy, including the transport of wind turbines and other OSOM movements for sectors such as mining, agriculture and defence.
If we apply this capacity range to the unconstrained demand from the previous chapter, results indicate that delivery of between 5–30% of wind generation capacity from these projects would be delayed to beyond 2030. This occurs as multiple projects are built at the same time and compete for capacity at ports and on delivery corridors. This leads to periods where wind project demand for OSOM movements exceeds assumed capacity for a corridor or port, even assuming no demand from other sources.
Under these circumstances, analysis indicates that where projects are impacted by capacity constraints, these could be delayed by at least 2.7 years on average.
Our analysis also shows a coordinated approach to optimise how this demand is allocated across ports and freight corridors – alongside the necessary upgrades to infrastructure on these corridors – could cut the delays to delivery of renewable energy capacity in half. Opportunities to optimise delivery include reducing pressure at the Port of Newcastle, by using the ports of Adelaide, Geelong and Portland to deliver the South West REZ in New South Wales and exploring the Port of Brisbane as an alternative for delivery of the New England REZ.
Logistics operations and regulations
Regulatory and operational constraints influence when and how OSOM movements can occur, shaping the effective capacity of freight networks. While physical infrastructure determines where movements are feasible, regulatory processes and access requirements define the conditions under which movements are permitted. These include decisions on the port of entry, transport mode, vehicle configurations and load limits, as well as the identification and approval of suitable routes and staging arrangements. Coordinating these elements often requires engagement across multiple infrastructure managers, road authorities and jurisdictions.
Managing access and safety
OSOM vehicles exceed normal heavy vehicle mass and dimensions and are classified as Class 1 ‘load carrying vehicles’ under the Heavy Vehicle National Law. These vehicles must comply with special conditions to operate, which may include securing access permits, approvals from state and local authorities, restrictions on routes or operating windows and requirements for pilots or escorts.44
Certain OSOM movements are pre-approved to operate without a permit under national exemptions from the National Heavy Vehicle Regulator, within prescribed dimensions and other conditions. Reforms are also underway to streamline access and permit arrangements for many OSOM and other heavy vehicles, such as the National Automated Access System.45 However, most OSOM movements to transport wind turbine components exceed pre-approved dimension limits and involve more significant access, safety and compliance requirements.
While regulating safe access of OSOM vehicle movements across the network is essential, feedback from industry highlights that the permit process can be complex and time-consuming, resulting in added costs and delays. Permit processes also place significant administrative burdens on governments, network managers and regulators. Growing demands for onshore wind developments will increase the volume of activity for developers, regulators and infrastructure managers to manage OSOM access. Reliance on permit‑based access, limited flexibility in access rules and inconsistencies across jurisdictions risk adding to these burdens without reform.46
In practice OSOM movements must travel at slow speeds, often travelling long distances over multiple days. This requires managing the impacts of OSOM movements that may create safety risks or delays for other traffic and managing driver fatigue under the Heavy Vehicle National Law, which may require additional provision of overtaking lanes, pull-over bays and heavy vehicle rest areas.
Increasing and inconsistent requirements for pilot and escort resources
Each wind turbine movement involves a complex and coordinated logistics operation, typically using multiple pilot and escort vehicles to perform critical safety and compliance roles. Requirements for pilots and escorts are determined by individual states and territories. Several, such as New South Wales and South Australia, require escorts (authorised to direct traffic under Australian road law) to be provided by police forces.47,48 Others require escort by police or other accredited providers, such as Safety Compliance Officers in Victoria or Traffic Escort Wardens in Western Australia.
There is already evidence of shortages of pilot and escort resources making it difficult for projects to secure these when needed, which can delay delivery schedules and add to the build-up of turbines stored at ports.49 Even where vehicles and routes are fully approved, shortages of pilots and escorts can lead to delayed or aborted trips, resulting in idle plant and labour, construction delays and higher costs. The National Heavy Vehicle Regulator indicates the daily cost of an idle OSOM vehicle is estimated at $5,000–6,000, rising significantly for complex projects such as wind farms.50
These issues are compounded by inconsistent pilot and escort arrangements across jurisdictions. Resourcing, training and accreditation requirements for pilots and escorts vary between states and territories,51 which may lead to inefficiencies in coordinating cross-border OSOM movements. In some jurisdictions, the adoption of certified pilots with extended training requirements creates additional barriers for other states to align.
As the number of projects in simultaneous construction grows, increasing volumes of OSOM movements will stretch resources and present a risk to the timely roll-out of wind projects, particularly alongside competing OSOM demand from other sectors such as mining and agriculture. Continued reliance on police resources to perform escort roles may no longer be feasible.
Analysis conducted by the National Heavy Vehicle Regulator with Infrastructure Australia, using the same project data from our analysis, identifies that under current arrangements OSOM movements could require more than 42,000 escorts (for directing traffic), 30,000 police escorts, 80,000 pilots (for warning other road users, guiding movement and ensuring safe transport) and 39,000 certified pilots (pilots who have met specific training and experience requirements, as used in some states), based on a mid‑level representative vehicle.
Logistics industry capacity
OSOM vehicle movements require a range of specialist vehicles and skilled operators, which are in finite supply. The capacity of available vehicle and operator resources in the market is not easy to determine but is likely to be stretched by rapid growth in demand from the energy sector over the next few years, especially for a workforce which already faces significant constraints.
The Australian Logistics Council estimates an existing workforce shortage of around 26,000 heavy-vehicle drivers, with supply further limited by an ageing workforce where approximately 47 per cent of drivers are aged over 55 and around 21 per cent are projected to retire by 2029.52,53 This workforce pressure is consistent with findings by the Productivity Commission, which has identified driver shortages and an ageing workforce as system‑wide constraints affecting the heavy vehicle sector, with a need to reform training and licensing pathways.54
Community impacts and social licence
Delivery of renewable energy projects depends on strong community support. When communities feel excluded from decisions or perceive that impacts outweigh the benefits, trust declines and opposition grows.55 Onshore wind developments can create concern about turbine placement, land use, noise, visual impacts and how benefits are shared. Proposed measures such as aviation lighting requirements illustrate the challenge of balancing precautionary regulation to address safety concerns with the cumulative and highly visible impacts experienced by local communities.56
The supporting freight task for onshore wind brings similar social licence risks. The concentration of prolonged construction activity in regional areas over many years will generate increased freight traffic. This includes a steady stream of OSOM loads, with many occurring on routes that currently experience limited OSOM activity. Infrastructure constraints, route restrictions and access to project sites can require OSOM vehicles to divert onto local networks, which can impact amenity in regional communities, disrupt other local traffic and accelerate the deterioration of local road infrastructure. Developers report difficulties moving OSOM convoys through sensitive areas such as entertainment precincts and school zones, while councils have cited delays to school bus services and safety concerns for local road users.57
Australian governments have an important role to play in enabling a more coordinated and efficient energy transition
Australian, state and territory governments are already driving progress on net zero and the energy transition through policy leadership, planning and regulatory reforms, intergovernmental coordination and substantial investments in energy infrastructure.
The massive uplift in energy investment and simultaneous construction of energy projects in concentrated areas across the country is unprecedented in its pace, scale and complexity. This requires Australian, state and territory governments to intervene in coordinating and enabling the planning and delivery of the renewables transition, to:
- Meet renewable energy and emissions reduction goals and avoid delays that would impact progress on key national targets, energy security and household bills.
- Ensure enabling infrastructure investment such as transmission and transport is coordinated and planned strategically, delivered efficiently and designed to maximise public benefits. At the same time, public investment in enabling infrastructure can overcome first mover disadvantage for developers, reduce development costs and encourage private investment.
- Manage impacts on communities, including for environmental and amenity impacts of construction, operations, renewal and decommissioning, social impacts of OSOM movements on other local and freight traffic, and legacy benefits for communities.
Currently, OSOM freight delivery for wind projects is largely shaped by individual project‑level planning and decisions about ports, freight routes and solutions to circumvent constraints and requirements on individual proponents to secure approvals for OSOM movements and infrastructure works.
This limits the visibility of overall demand, reduces the ability of infrastructure managers to anticipate and manage emerging bottlenecks and creates inefficiencies due to duplication of planning, engagement and regulatory approvals processes, while opportunities to improve efficiency through infrastructure improvements may be beyond the capacity of individual project proponents.
Infrastructure Australia’s research demonstrates that the scale and pace of wind project development mean that a ‘business‑as‑usual’ approach to OSOM delivery for wind projects is unlikely to be sufficient.
National coordination is needed to coordinate and optimise this freight task at a system level and reduce the time and costs of delivery. This requires:
- Coordinated policy or regulatory changes at the national level or through aligning rules across jurisdictions to improve efficiency and reduce duplication of planning and approvals.
- Coordinated planning to reduce the need for bespoke route investigations and optimise the use of existing port and road network capacity to manage cumulative demand efficiently, reducing capacity pressures, community impacts, costs and risks of delays in the supply chain for renewables delivery.
- Coordinated investment in improvements to address port and road infrastructure constraints on optimal delivery corridors, to increase capacity, enable the safe and efficient delivery of wind projects and provide certainty to industry proponents. This includes where investment offers complementary benefits for freight productivity, road safety and resilience objectives.
The next chapter of this report provides further information on Infrastructure Australia’s assessment of specific infrastructure constraints. This includes detailed findings in relation to the infrastructure needs for each of the priority corridors identified in the previous chapter.
Infrastructure constraints and needs on priority corridors
Analysis of infrastructure constraints identified in wind project route planning shows over 900 constraints across the road network. Nearly half (47%) are located on key national freight routes, including a high proportion of more complex constraints such as bridge heights, while access routes at ports also present common barriers.
Priority delivery corridors across Queensland, New South Wales, Victoria and South Australia face recurring infrastructure challenges, including bridge load limits, height clearances, constrained intersections, limited passing opportunities and insufficient rest or staging facilities for over-size, over-mass movements.
While infrastructure constraints do not entirely prevent delivery of turbine components, targeted investments in port access and freight corridor upgrades will be critical to reduce delays, improve safety and route efficiency, and strengthen Australia’s capacity to deliver the onshore wind capacity needed to support the energy transition.
Nearly half of infrastructure constraints are on national road freight networks, while port access is a common issue
As projects progress through the planning process, wind project proponents conduct route studies to identify delivery routes and potential infrastructure constraints. Analysis of these route studies for the wind projects included within our scope identified over 900 constraints relevant to OSOM movements out of ports and along freight corridors and intersections.
Overall, most identified constraints relate to width constraints (77%), followed by height constraints (13%). Most width constraints relate to the need to move signage, street furniture, fencing or vegetation, or the need for pavement widening or additional hardstand on intersections, while height constraints predominantly refer to vertical clearances from overpass bridges.
Nearly two-thirds of over-size, over-mass (OSOM) vehicle movements will travel on the National Land Transport Network and/or Key or Secondary Freight Routes. Almost half of identified constraints (47%) occur on national road networks, with four out of every five (79%) identified height constraints (such as vertical clearance from overpass bridges) and a quarter (25%) of all mass constraints (due to load limits of bridges and floodways) located on these networks.
Figure 16 visualises the locations of road network constraints based on the count of constraints identified in wind project route studies. This illustrates ‘hotspots’ where infrastructure constraints are most concentrated across the network, based on the 56 projects included in our analysis.
Many of these areas indicate a high proportion of constraints around the high-demand ports and road corridors identified in the earlier chapter on demand, for port access and road corridors connecting to Townsville, Gladstone, Brisbane, Newcastle, Geelong, Portland and Adelaide.
Fewer constraints are identified in other jurisdictions, which reflects both the scope of the analysis and differences in the scale of onshore wind development across the country. In Western Australia, limited evidence of national road network constraints is also consistent with substantial previous investment in road networks to support over-size, over-mass (OSOM) freight in the state.
This constraints data reflects the least-cost delivery paths identified by proponents and typically accounts for the need to avoid other major constraints that would be time or cost prohibitive for proponents to address. As a result, this data also excludes certain constraints and may also not reflect the most efficient or desirable delivery routes if these constraints were addressed.
Figure 13: Heatmap of identified road constraints for projects included in our analysis
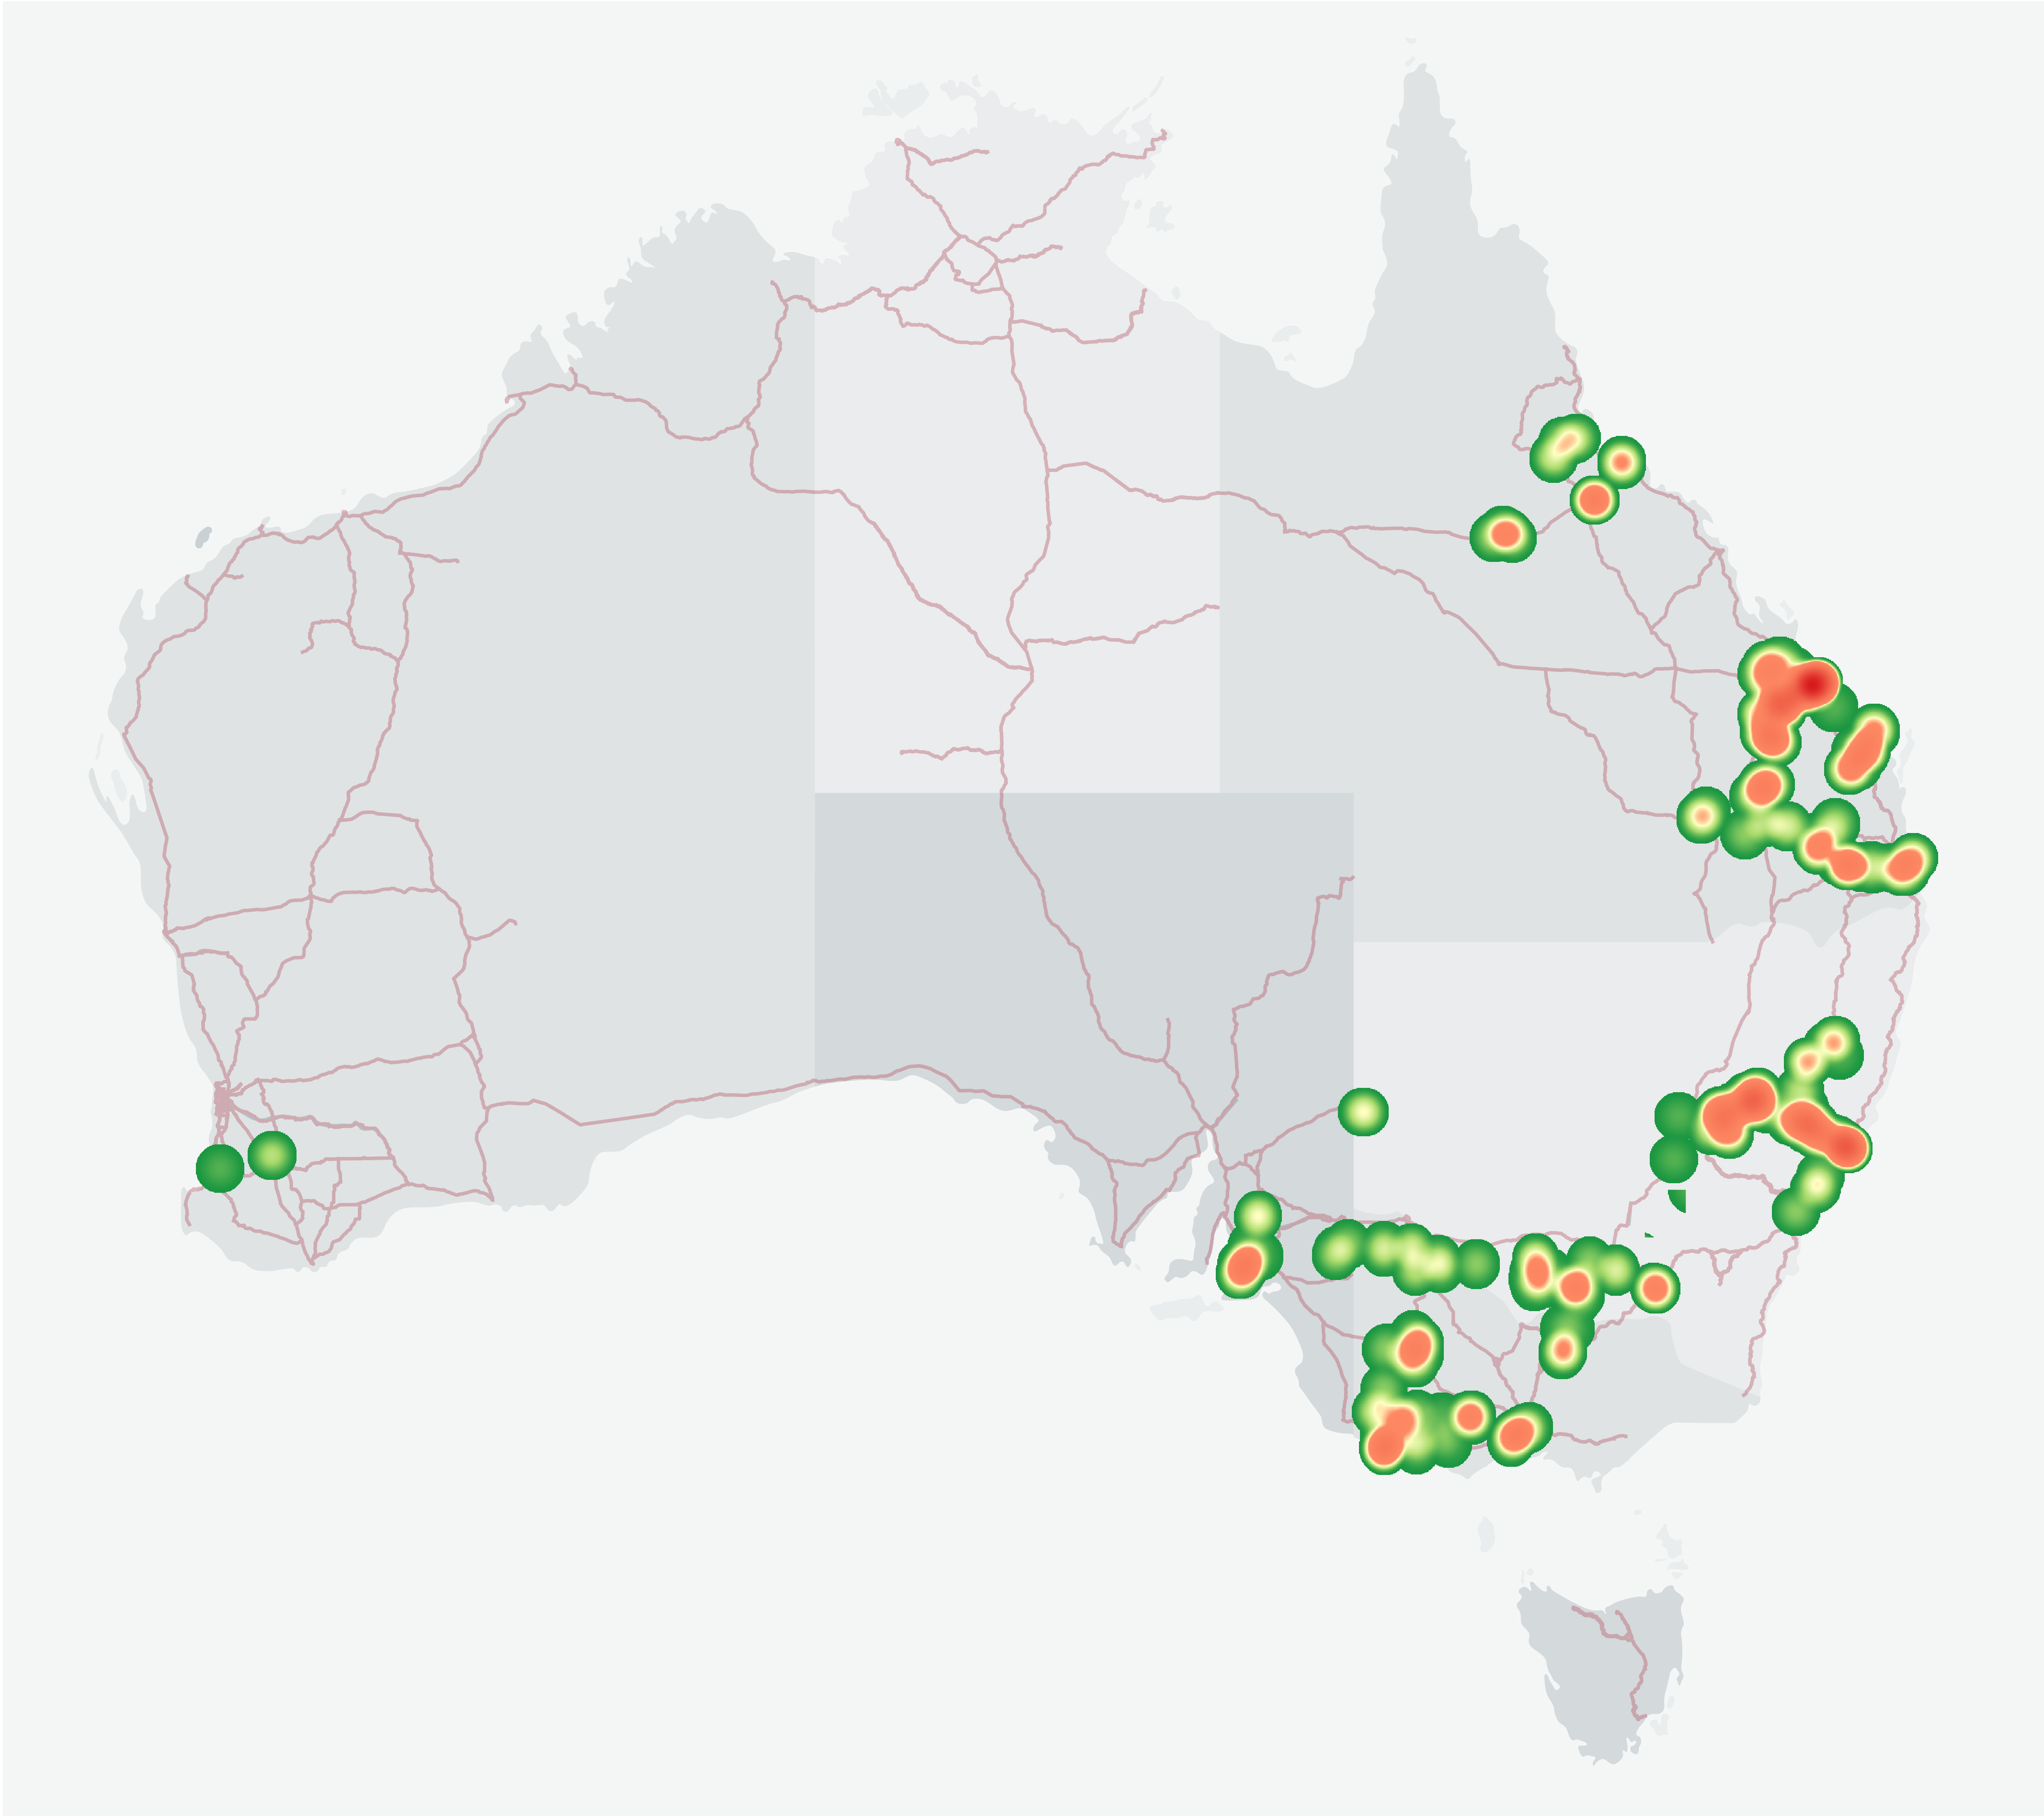
Note: The heatmap presents data on the count of constraints identified in route studies conducted by project proponents. Data does not account for differences in route study methodologies, which vary in the scope or level of detail in how constraints are reported. Data may also include duplicates where constraints occur more than once in the data if identified by multiple proponents in separate route studies.
Source: Infrastructure Australia (2026)
Infrastructure needs on priority corridors
We have identified eight critical road corridors for delivering onshore wind projects in the National Electricity Market, describing expected delivery routes and volumes of over-size, over-mass (OSOM) wind turbine components to be transported for the projects included in our analysis.
Private-sector energy project developers will typically be responsible for delivering localised enabling infrastructure works, which are often tied to the needs of a single project. Proponents will consider trade-offs between the costs of infrastructure works and alternative operational solutions such as taking longer delivery routes to avoid constraints.
More substantial infrastructure works, such as bridge strengthening or replacement, road widening or increasing bridge height clearances are typically much more expensive and far less likely to be funded and delivered by a single proponent. These types of infrastructure improvement require a government-coordinated approach to planning and investment and can unlock more direct, efficient delivery routes for multiple projects as well as more lasting benefits that extend to other traffic.
Government-coordinated approaches may need to establish mechanisms to capture proportionate funding contributions from proponents to the cost of infrastructure upgrades required to facilitate wind projects. This would avoid the excessive transfer of costs from private industry to the public sector while supporting more strategic planning and efficient investment in enabling infrastructure.
Below we provide details of specific identified infrastructure constraints or needs to facilitate the delivery task related to port capacity, access and road infrastructure on these key freight corridors. These have been determined by a combination of analysis of published wind project route planning data and in-depth investigation and validation of constraints by Infrastructure Australia including use of other publicly available data and extensive engagement with governments and industry.
1. Townsville to Northern Queensland
Port capacity and access infrastructure
The Port of Townsville is increasing capacity to cater for wind turbine freight. In early 2026, the port completed a dedicated 140,000m2 Project Cargo Laydown Area and associated transport upgrades to support imports of wind turbine components, including blades up to 100m long. While our analysis identified potential width constraints for OSOM vehicles exiting the port, further works planned in 2026 to enable a route for OSOM movements between key berths and the port’s new laydown area may also address these constraints.
Road network infrastructure
Several potential constraints and infrastructure needs were identified on the delivery route using the Flinders Highway from the Port of Townsville. These currently require OSOM vehicles to travel via longer, slower alternative routes from the port, such as Hervey Range Road, which may also not be able to support increasingly large volumes of OSOM freight.
Several bridges on the Flinders Highway have limited structural capacity to cater for the expected dimensions and intensity of OSOM movements for heavy loads, potentially requiring bridge strengthening or replacement works. Key identified load limit constraints include the William Henry Webb Bridge over the Reid River and Macrossan Bridge over the Burdekin River, both on the Flinders Highway between Townsville and Charters Towers.
The road corridor also has height, width and road pavement constraints at specific locations, including the intersection of the Bruce and Flinders Highways and at intersections in Charters Towers. These are mostly minor, such as signage and light poles that present obstructions, though some are more significant such as obstructions from overhead power lines and a railway overpass bridge with height and width constraints on the Flinders Highway between Dundee Street and Gladstone Road. Delivery routes also require the provision of sufficient, appropriately designed and located passing bays or over-taking lanes as well as OSOM heavy vehicle rest areas.
Further constraints on local roads providing access from main freight routes leading to project sites (such as near Hughenden and north of Charters Towers) include poor quality or unsealed road surfaces, narrow road pavements and risks of disruption due to flooding.
2. Gladstone to Central Queensland
Port capacity and access infrastructure
The Port of Gladstone can import turbines at the Port Central precinct, which has 15,000m2 of laydown area and other land at the port for storage of wind turbine components if needed.
Proposed redevelopment of this precinct for a container terminal is expected to redevelop land used for OSOM laydown. The Northern Land Expansion Project at the port would support OSOM but is focused on bulk trades and larger vessels. Final plans were only approved in 2025 and development may not be complete for another 10 years.58
The primary focus of the development is also on supporting growth in bulk trades and catering for larger vessels.59,60 This may require a greater role for other ports in the region, such as Bundaberg and Mackay, to service onshore wind projects. Both ports are progressing developments to facilitate import and handling of wind turbines. Bundaberg, for example, has a proposed Marine Industry Precinct expansion including an OSOM cargo facility.61
There are major access constraints at the Port of Gladstone that prevent the efficient transport of turbines. OSOM vehicles would ideally exit the port via Port Access Road onto Hanson Road and Gladstone-Mt Larcom Road. However, current constraints mean most components must divert on local roads such as Flinders Parade and Lord Street (which also have length and width-related geometry restrictions) to access Gladstone-Mt Larcom Road. These diversions also impact the local community or may require components to be offloaded at alternative ports.62,63
Access constraints at Port of Gladstone may need to be addressed by strengthening works on the Bill Prest overpass over the railway and raising or reconstruction of the Goondoon Street overpass bridge on Port Access Road, and intersection modifications to address obstructed turns at the intersection of Port Access Road and Glenlyon Street and at the roundabout of Hanson Road and Blain Drive.
A rail overpass bridge in Gladstone also blocks access to the start of the Dawson Highway for OSOM vehicles exiting the port. This requires OSOM vehicles to divert west using Gladstone Mt Larcom Road and south using the Bruce Highway to access the Dawson Highway.
Road network infrastructure
Some freight route modifications have already been made to adapt highway intersections and roundabouts in central Queensland to facilitate wind turbine transport, but other infrastructure challenges remain that require further works or investigation.64
Key constraints on road corridors from the Port of Gladstone include significant bridge load limit and height constraints as well as intersections requiring modification. Bridges with a possible need for strengthening or replacement works include: bridges over the Calliope River, Calliope River Anabranch and Auckland Creek on Gladstone-Mount Larcom Road; bridges over Calliope River, Raglan Creek, Pandoin Rail Overpass, Twelve Mile Creek and Canoona Rail Overpass on the Bruce Highway; and bridges over Neerkol Creek on the Capricorn Highway and Collards Creek on the Dawson Highway.
Height clearance constraints may require potential regrading of roads or raising/reconstructing bridge structures. These include on the Dawson Highway under the rail line at Deep Creek, road overpass bridges at Calliope and between Argoon Kilburnie Road and Kilburnie Road, and on the Capricorn Highway overpass bridge at Power Station Road.
Intersections and bridges may require pavement or deck widening/reconfiguration to address obstructed turns and width clearance constraints. These include intersections on the Capricorn Highway with Gavial Gracemere Road, on the Leichhardt Highway with Burnett Highway and Defence Road, and narrow bridge decks over railways on Gladstone-Mt Larcom Road, the Bruce Highway south of Rockhampton and on the Capricorn Highway east of Wycarbah.
Major road corridors also require sufficient provision of appropriately designed and located passing bays or over-taking lanes as well as OSOM heavy vehicle rest areas.
There may also be a need to seal and upgrade sections of Apis Creek Road between Duaringa and Marlborough Road, which is largely unsealed north of Duaringa, and for flood immunity upgrades on highway routes in the Banana region. Further investigation of additional routes may also be needed from the ports of Bundaberg and/or Mackay (such as Childers Road from Bundaberg) if these ports are used to import significant volumes of turbine components.
3. Brisbane to Southern Queensland
Port capacity and access infrastructure
The Port of Brisbane has the capability to handle large wind turbine components and substantial storage capacity, with 250,000m2 of laydown area and other available land at the port.
There is currently limited operational capacity for OSOM movements out of the port with provision for around five movements per day, managed by a slot booking system, covering wind turbine components as well as other OSOM cargo leaving the port. This may not be sufficient to support peak periods of demand and require consideration of measures to increase throughput capacity from the port.
Port of Brisbane-controlled roads provide vehicle height clearances of 6.7m, which should be sufficient to cater for wind turbine components. Other routes such as Port of Brisbane Motorway may have potential height restrictions from overpass bridges and gantries that may impact some OSOM components, including at Pritchard Street (6.4m clearance), Lindum Road (6.2m clearance), Hemmant and Tingalpa Road (6.1m clearance) and Link Road on-ramp (6.1m clearance).
Road network infrastructure
A key road pinch point on the corridor is Dogwood Creek Bridge on the Warrego Highway at Miles, which cannot cater for heavy OSOM loads. This requires a lengthy 278km detour, or a shorter 140km detour on local roads including Roma-Condamine Road, many of which are in poor condition.
The corridor route also requires other diversions to overcome constraints. These include:
- A potential 36km diversion from Logan Motorway south on Centenary Motorway to Ripley and back to avoid multiple height-constrained bridges over the Logan Motorway.
- A local detour between Plainland and Gatton to avoid the Outer Ring Road overpass bridge on the Warrego Highway.
- Multiple minor diversions using off-ramps and on-ramps to avoid height constraints from overpass bridges on the Warrego Highway.
Potential widening and reconfiguration of intersections is also needed on the Warrego Highway to enable turning movements of OSOM vehicles. These include at the Toowoomba Bypass off-ramp onto Warrego Highway and intersections of the Warrego Highway/Jandowae Road and Warrego Highway/Leichhardt Highway west of Miles.
Other examples include potential constraints at rail level crossings close to intersections on the Warrego Highway at Chinchilla and Columboola and on the Leichhardt Highway at Miles, as well as on local detour routes where height of load limit constraints that require diversions cannot be addressed.
The Warrego Highway may also require pavement strengthening and culvert replacements on certain sections, as well as sufficient provision of appropriately designed and located passing bays or over-taking lanes and OSOM heavy vehicle
rest areas.
4. Newcastle to Central West-Orana, New South Wales
Port capacity and access infrastructure
The east coast of New South Wales has limited ports with storage capacity for wind turbine imports, other than the Port of Newcastle. This results in a high concentration of demand at the port for projects across the state, including the Central West-Orana and New England Renewable Energy Zones. Significant investments are already being made by the port and the New South Wales Government to increase laydown area capacity at the port. However, capacity bottlenecks remain likely with peak periods in demand set to exceed practical capacity for the throughput of turbine components at the port, resulting in potential delays to wind project delivery.
The current exit route from Port of Newcastle requires widening and modification of intersections to allow turning movements for larger turbine blades from Quayside Close onto Selwyn Street, Industrial Drive and the Pacific Highway. These are expected to be addressed by planned infrastructure improvements, while the potential for alternative exit routes from the multipurpose terminal at the port are also being investigated by the Port of Newcastle.
In addition to current plans to improve access and storage capacity, action may be needed to reduce pressure on Port of Newcastle capacity, including identifying opportunities to manage demand efficiently by use of alternative ports for some turbine components and investigation of inland storage capacity or staging areas to avoid storage of components at the port for extended periods.
Road network infrastructure
The Golden Highway has multiple intersections and pinch points likely to require pavement widening and reconfiguration to address obstructed turns and width clearance constraints for vehicle configurations transporting turbine blades, as well as potential infrastructure or operational solutions to address railway crossings at Denman and Dunedoo.
Bridges on the Golden Highway need detailed assessment of structural capacity and potential strengthening or replacement works. This includes bridges over the Hunter River, north of Jerrys Plains, west of Merriwa, and over railway lines between the New England Highway and Mount Thorley. Bridges on Wybong Road, part of the Denman diversion route, also may require upgrades such as bridges over Sandy Creek, Spring Creek and Wybong Creek.
Height clearance constraints on the corridor may require regrading of roads, raising or reconstruction of bridges to enable OSOM movements. These include the New England Highway overpass bridge at Tarro Interchange, multiple overpass bridges on the Hunter Expressway such as at Averys Lane, Main Road/Kurri Kurri Interchange, Lovedale Interchange, J L Horseman rail bridge and Old Maitland Road, and Denman Bridge on the Golden Highway.
The corridor may also need permanent movement of overhead utility lines at various locations to remove height constraints, as well as sufficient provision of appropriately designed and located pull-over bays and/or over-taking lanes, OSOM heavy vehicle rest areas and staging areas.
Addressing some of these constraints is already the focus of upgrades being delivered under the New South Wales Government’s Port to Renewable Energy Zones program, though further stages of upgrades are likely required to fully enable the corridor as an OSOM delivery route.
5. Newcastle and Brisbane to New England, New South Wales
Port capacity and access infrastructure
The previous chapter identifies the Port of Newcastle as the primary port of entry for projects in the New England REZ. The Port of Brisbane may be a potential alternative port of entry, though as previously discussed the viability of this cross-border route to support OSOM movements for wind projects would need to be assessed. Port capacity and access challenges for both ports are discussed above.
Road network infrastructure
Assessment of the structural capacity of bridges along the New England Highway will be needed, with some expected to have limited structural capacity or deficiencies that require strengthening or replacement works. This includes bridges on bypass routes around major towns, such as strengthening and widening the deck of the bridge on Nundle Road over Cockburn River at Nemingha on the bypass route around Tamworth.
Height clearance constraints on the New England Highway also require investigation and potential infrastructure work. This includes potential vertical realignment of roads, or raising or reconstruction of bridges, to provide sufficient vertical clearances on the corridor. Examples include the rail bridge overpass at Singleton, east of Maison Dieu Road (5.4m clearance), and road overpasses north of Rixs Creek Lane (5.5m) and at Liddell Interchange (5.2m).
At Muswellbrook, intersection and rail bridge overpass height and width constraints on Bridge Street in the centre of town restrict movements to vehicles within dimensions of 4.6m width, 5.2m height and 30m length. This may require intersection modifications to enable interim bypass routes for OSOM vehicles around the town, such as at Wybong Road/Kayuga Road and Invermein/Stair Streets, until construction of the Muswellbrook Bypass is completed as a longer-term solution.
At Tamworth, bypass routes to avoid the town centre are expected to need modifications at the intersections of New England Highway/Whitehouse Lane, Whitehouse Lane/Marsden Park Road, Marsden Park Road with Calala Lane/O’Briens Lane, O’Briens Lane/ Nundle Road and Nundle Road/New England Highway. Marsden Park Road also requires pavement upgrades and sealing. The need for detour routes for other towns along the corridor may also need investigation, such as at Armidale and Uralla.
The New England Highway corridor may need permanent raising of overhead utility lines in sections, as well as potential removal or reconfiguration of other overhead obstruction, such as gantries and traffic signal masts at intersections. The corridor includes narrow sections, such as through the Moonbi Range, that may need widening and also requires sufficient provision of appropriately designed and located passing bays, over-taking lanes and new or upgraded OSOM heavy vehicle rest areas.
6. Geelong to South West, New South Wales
Port capacity and access infrastructure
Geelong Port has the capacity and capability to import wind turbine components but may experience capacity pressures that could delay projects. The port projects it has capacity to support future turbine imports based on an installation rate of 600 MW generation capacity per year.65 We estimate this would equate to around 90 turbines and 1,200 OSOM movements of turbine components a year. Our analysis of wind projects shows peak demand at the port exceeding this, with projected demand for projects in Victoria and New South Wales requiring the import of nearly 1,900 onshore wind turbine components through the port in 2028 and over 2,000 components in 2029 and 2030.
The port has a substantial 400,000m2 of laydown capacity. However, this may face competing demands from other cargo at the port, and some wind developers have indicated a shortage of storage capacity for turbines. If a proposed renewables terminal at the port proceeds, this is expected to be configured to support offshore wind construction and operations, so it is unclear if this could provide additional offloading and storage capacity to support onshore wind projects.66
Port access for OSOM vehicles exiting Geelong Port has been improved in places to enable larger turbine components to access routes heading west. Different routes may be used to exit the port for different components based on their dimensions. Turbine blades typically need to exit the port to the south via Corio Quay Road and the Princes Highway while tower sections typically exit to the north to avoid height constraints.
Further port access modifications may be needed to enable these movements, including strengthening or reconstruction of bridges with potential structural constraints on routes out of the port. These may include on Corio Quay Road over Cowies Creek and the railway line and on the Princes Freeway over Barwon River, over High Street, over Moorabool River, and over the railway line and Cowies Creek near Bell Post Hill.
Road network infrastructure
For the easterly route from Geelong to Tocumwal via Melbourne, potential infrastructure constraints and requirements include:
- Detailed loading assessment of the structural capacity of bridges, to identify where strengthening or replacement works may be needed – including:
- On the Hume Freeway – including bridges over Lithgow Street at Beveridge; over Wandong Road, the railway line and the Dene at Wandong; over Sunday Creek and McDonalds Road; over the Hume Freeway offramp, railway line and Main Road at Tallarook; and over Emily Street, Stony Creek and the Goulburn River at Seymour.
- On the Goulburn Valley Freeway between Seymour and Tocumwal – including bridges over Hughes Creek, the Goulburn Valley Railway line north of Tabilk, Racecourse Road, the East Goulburn Main Channel, Murchison-Violet Town Road, Castle Creek, Seven Creeks Bridge, Broken River, Nine Mile Creek, Broken Creek, No.5 Main Channel at Katunga, and water bodies south of Tocumwal.
- Bridge over the Murray River on the New South Wales/Victoria border at Tocumwal.
- Intersection pavement widening and reconfiguration, including making roundabouts mountable for OSOM vehicles – including:
- on the Goulburn Valley Freeway around Shepparton (e.g., at Goulburn Valley Highway/River Road, Doyles Road and Grahamvale Road/Goulburn Valley Highway), particularly for turbine blades if unable to use the Shepparton bypass or travel through the town.
- at Goulburn Valley Highway /Murray Valley Highway (at Rockliffs Road, west of Strathmerton), where the Goulburn Valley Highway/Murray Valley Highway turns north towards Koonoomoo and Tocumwal.
- at the Newell Highway/Conargo Road in Jerilderie, Sturt Highway/Kidman Way south of Darlington Point and at Sturt Highway/Cobb Highway in Hay South.
For the westerly route from Geelong to Tocumwal, via Skipton and Beaufort, potential infrastructure constraints and requirements include:
- Detailed loading assessment of the structural capacity of bridges, to identify where strengthening or replacement works may be needed. This includes multiple bridges on the Midland Highway, Hamilton Highway and Calder Highway, as well as bridges on other state and local-controlled routes in Victoria with mass and/or width constraints.
- Intersection pavement widening and reconfiguration, including making roundabouts mountable for OSOM vehicles. Examples include on the Midland Highway at the intersections with Ballan Road/Creamery Road and roundabouts at the intersections with Fyansford Gheringhap Road and Geelong Road. Other intersections on state and local-controlled routes along the delivery route may also need modifications, such as at Skipton Geelong Road/Glenelg Highway, Beaufort Lexton Road/Lexton Ararat Road, Sunraysia Highway/Williamson Street, roundabout at Melbourne Road/Inglewood Road, Boort Mitiamo Road/Pyramid Yarraberb Road, Pyramid Yarraberb Road/Bendigo Pyramid Road.
- Multiple interfaces with rail networks, which will require approvals and may need modifications at level crossings close to intersections or roundabouts, such as at the intersection of Geelong Road/High Street in Bannockburn, at Echuca-Serpentine Road/Bendigo-Pyramid Road, and on Bendigo-Pyramid Road at Mitiamo.
7. Adelaide to South West, New South Wales
Port capacity and access infrastructure
Port Adelaide already handles large-scale wind turbine imports. The port has substantial laydown area capacity for storage of turbine components at the port, including the ability to manage additional demand through operational solutions such as use of other available land at the port and use of alternative berths for some OSOM components. However, capacity may come under pressure from increasing demand from inter-state and intra-state projects, which may require additional inland storage or staging areas to support efficient movement of turbine components.
Road access at Port Adelaide is largely suitable for OSOM vehicles, with access modifications previously made at the port to enable movements of turbines with 85m blades onto the Port River Expressway. Some further access modifications at the port may be needed to cater for larger turbine blades of 100m or more.
Road network infrastructure
OSOM movements from Adelaide currently use different routes to access the Sturt Highway based on their dimensions, with height constraints on the Northern Expressway requiring higher loads such as tower sections to travel north on Port Wakefield Road via Two Wells and east on Gawler Road. This route relies on detours using local roads to the north of Gawler to avoid overpass bridges, intersections and roundabouts with height and width constraints on Two Wells Road and Gawler Bypass Road where these pass under the Northern Expressway, and limited bridge height clearances on the Sturt Highway at Redbanks Road (5.2m) and Sir Condor Laucke Way (6.0m).
Detailed assessment of bridge structural capacity and horizontal clearances on the Sturt Highway to cater for OSOM movements is needed. This includes bridge structures over the Murray River between Blanchetown and Paisley, at the Euston-Robinvale bridge at the border of New South Wales and Victoria, over the Murrumbidgee River at Balranald and at Yanga Creek (north of Yanga Lake).
Intersection widening and reconfiguration, and making roundabouts mountable for OSOM vehicles, is also expected to be necessary. Examples include at intersections of Stanitzki Road/Sturt Highway, Meringur North Road/Werrimull North Road, the Calder Highway/Hattah-Robinvale Road, Hattah-Robinvale Road/Robinvale Sea Lake Road, Murray Valley Highway/Sturt Highway at Euston, and at the Market Street/McCabe Street intersection in Balranald. Level crossings on the route may also need infrastructure modifications, including a restricted crossing at the rail line close to the intersection of Millewa Road/Calder Highway, south of Red Cliffs.
The Sturt Highway corridor may also need permanent movement of overhead utility lines where these present obstructions to OSOM vehicles and sufficient provision of appropriately designed and located passing bays, over-taking lanes and new or upgraded OSOM heavy vehicle rest areas.
8. Portland and Geelong to West and North-West Victoria
Port capacity and access infrastructure
As our analysis in the previous chapter shows, both ports of Portland and Geelong are expected to see significant demand for wind turbine imports in the next few years.
In addition to port capacity and access issues for the port of Geelong, discussed above, the Port of Portland also has the capability to handle the import of turbines, though primarily it has handled smaller components such as blades of up to 74m long. There is 60,000m2 of hardstand storage on site at the port and an additional 100,000m2 of off-site inland storage.
Some access constraints at the Port of Portland have already been subject to investment, including allocation of funding by the Victorian Government to address constraints for over-dimensional loads on Port Road, while other constraints may be bypassed via alternative exit routes from the port. There may still be constraints at the port for handling larger, modern turbines, particularly relating to height limits on access roads, requiring some components such as tower sections to use local roads heading south from the port and looping around to the west to access the Henty Highway.
Road network infrastructure
In addition to road network infrastructure constraints identified for routes from Geelong on the corridor between Geelong and Skipton (discussed above), a range of potential infrastructure constraints have also been identified for routes from the Port of Portland to project locations in the west and north-west of Victoria.
These include along the Henty Highway in exiting Portland, with width constraints at the intersection with New Street, and potential width constraints and road condition issues at intersections of: the Princes Highway/Henty Highway (at Heywood); Henty Highway/Glenelg Highway (at Hamilton); Glenelg Highway/Coleraine-Edenhope Road (at Coleraine); Glenelg Highway/Portland-Casterton Road (at Casterton); Western Highway/Nelson Street (at Nhill); and Western Highway/Wail-Dooen Road (at Wail).
Other routes from Portland to the east and northeast also have potential infrastructure constraints. These include potential width and intersection constraints along the road corridors from Portland to Woolsthorpe and between Hamilton and Skipton.
Sufficient provision of appropriately designed and located pull-over bays, over-taking lanes and new or upgraded OSOM heavy vehicle rest areas will also need to be ensured.
While data from proponent plans analysed by Infrastructure Australia indicates that Portland will primarily serve wind projects within Victoria, more recent stakeholder engagement indicates that some interstate projects such as those in the South West of New South Wales now plan to use the Port of Portland as a port of entry. This may have implications both for capacity at the port and the need to investigate and ensure road freight routes from Portland to New South Wales are able to support cross-border OSOM movements for wind turbines.
Opportunities for optimisation
National priorities for enabling infrastructure investigation and optimisation
Infrastructure Australia has identified four priority corridors for detailed investigation and investment in infrastructure upgrades to support the delivery of onshore wind capacity, which were included as proposals in our 2026 Infrastructure Priority List.
While all the identified corridors in this report are important for delivering onshore wind infrastructure, these four are recommended as national priorities based on a combination of factors, including:
- the scale of planned onshore wind development in these regions.
- the timeframes for delivering onshore wind capacity in the context of achieving national renewable energy and emission reduction targets.
- the significant role of national road networks and interstate freight corridors in delivery.
- the evidence of addressable infrastructure constraints and opportunities for optimisation.
These priorities are focused in eastern and southern states, due primarily to the increased scale of onshore wind development and the significant national share of energy generation in these states, making these locations central to achieving the energy transition for the National Electricity Market.
1. Port of Gladstone to Central Queensland
View Proposal on Infrastructure Priority List.
Central Queensland is an identified Regional Energy Hub for the state and has a high concentration of planned renewable energy development, including onshore wind. The Port of Gladstone is a priority port for Queensland and the expected primary port of entry for the import of large electricity generation components for the region, such as wind turbines.
Access routes at the Port of Gladstone and strategically important road routes to Central Queensland including the Bruce, Dawson, Capricorn and Leichhardt Highways and Gladstone-Mt Larcom Road cannot accommodate the OSOM vehicles required to transport large renewable energy components.
Priorities for further investigation and potential investment include:
- Ensuring sufficient capacity at the Port of Gladstone to support energy development needs in Central Queensland over the next 5–10 years, alongside other sectors of the economy, and the potential for other regional ports such as Bundaberg and Mackay to perform a supporting role as part of an optimised multi-port solution.
- Determining priority access routes and infrastructure upgrades to support wind turbines and other over-dimension vehicle movements out of the Port of Gladstone, including potential upgrades to bridge structures on Port Access Road to improve efficiency and reduce impacts of local diversion routes on the local community.
- Defining upgrades to strategically important freight routes to enable safe and efficient OSOM movements between ports and energy development locations, particularly the Bruce, Dawson, Capricorn and Leichhardt Highways and Gladstone-Mt Larcom Road. Planning for infrastructure improvements to enable OSOM movements for wind projects should where possible be addressed through existing corridor planning activities, such as for the Bruce Highway, and identify opportunities for upgrades that support a range of beneficial outcomes.
2. Port of Newcastle to Central West-Orana Renewable Energy Zone
View Proposal on Infrastructure Priority List.
The Central West-Orana REZ is expected to deliver significant uplift in renewable energy generation by 2030, including major transmission, wind and solar energy projects. Delivery of these projects relies on berth, offloading and storage capacity at the Port of Newcastle and the strategic road corridor between the port and the REZ that includes the Pacific Highway, John Renshaw Drive, the Hunter Expressway and the Golden Highway.
The port is not equipped to support the expected growth and simultaneous delivery of multiple projects in the Central West-Orana REZ. Road routes to the Central West-Orana REZ also cannot currently accommodate the OSOM vehicles required to transport wind turbine components.
Priorities for further investigation and potential investment include:
- Ensuring sufficient capacity at the Port of Newcastle to support energy development needs across multiple regions of New South Wales, alongside other sectors of the economy. This includes determining:
- the need for further upgrades to offload or storage capacity for wind turbine freight at the port and improvements to OSOM access, in addition to existing investments by the Port of Newcastle and NSW Government in expanded laydown area at the port.
- the potential role of an inland staging area to provide additional storage capacity for turbine components and reduce capacity pressures at the port.
- the role for other ports to deliver wind projects in other regions of New South Wales as part of an optimised multi-port solution to maximise efficiency and alleviate potential capacity bottlenecks at Newcastle. This includes ports such as Port Kembla to support delivery in southern regions of the state and cross-border coordination on the role of interstate ports (see priorities 3 and 4 below).
- Defining upgrades to the road network between the Port of Newcastle and the Central West-Orana REZ, including the Golden Highway, to address height, width and mass constraints, level crossing pinch points at Denman and Dunedoo, and ensure adequate pull-over bays are provided on the corridor. This includes detailed loading assessment of bridge structures, widening and reconfiguration of intersections and narrow road corridor sections to allow transport of turbine blades, and regrading roads or raising of bridge structures to address height constraints on the Hunter Expressway and New England Highway. This is in addition to upgrades already being delivered under the New South Wales Government’s Port to Renewable Energy Zones program.
3. Ports of Newcastle and Brisbane to New England Renewable Energy Zone
View Proposal on Infrastructure Priority List.
The New England REZ is expected to provide 8 gigawatts (GW) of renewable energy generation capacity by 2037, including significant onshore wind development. These projects will rely on the Port of Newcastle as the primary port of entry and the strategic road corridor that includes the New England Highway, as well as sections of the delivery route for the Central West-Orana REZ including the Golden Highway as far as Denman.
The port is not equipped to support the expected growth and simultaneous delivery of multiple projects in the New England REZ and Central West-Orana REZ. Port of Brisbane as an alternative port of entry for the New England REZ also requires investigation. Road routes to the New England REZ also cannot accommodate the OSOM vehicles required to transport wind turbine components.
Priorities for further investigation and potential investment include:
- Ensuring sufficient capacity at the Port of Newcastle to support timely delivery of energy demand in the New England REZ alongside demands from Central West-Orana REZ (as described above at priority 2) and other sectors of the economy.
- Coordination across the New South Wales and Queensland Governments to investigate the potential role and capacity of the Port of Brisbane as an alternative port and determine access routes and constraints for the movement of OSOM vehicles to access the New England REZ.
- Defining upgrades to strategically important freight routes to support the expected OSOM movements between ports and the New England REZ, particularly the New England Highway. Planning for infrastructure improvements to enable wind projects should where possible be addressed through existing corridor planning activities, such as for the New England Highway, and identify opportunities for upgrades that support a range of beneficial outcomes.
4. Ports of Adelaide and Geelong to South West Renewable Energy Zone
View Proposal on Infrastructure Priority List.
The Port of Newcastle is the planned port of entry for most wind projects in New South Wales. However, capacity constraints at the Port of Newcastle and long, complex and higher cost delivery routes from the port to the South West REZ, as shown earlier in this report, mean the port is not currently equipped to support efficient delivery of projects in the South West REZ.
Interstate ports such as Adelaide and Geelong, as well as Portland, are expected to provide primary ports of entry for wind projects in this region. This requires coordination between jurisdictions to assess port capacity and access needs and improvements required on cross-border road freight corridors to address height, width and mass constraints, ensure adequate pull-over bays and rest areas, and support delivery of expected OSOM wind turbine freight.
Priorities for further investigation and potential investment include:
- Ensuring sufficient capacity at the ports of Adelaide, Geelong and Portland as optimal ports of entry to support demand for interstate wind projects in the South West REZ alongside wind projects and demand from other sectors of the economy within South Australia and Victoria.
- Defining any further road access improvements required at the ports of Adelaide, Geelong and Portland to accommodate OSOM vehicles required to transport large renewable energy components, noting previous access modifications already made at all three ports.
- Defining upgrades to strategically important freight routes to enable safe and efficient OSOM movements between ports and development locations for wind projects within relevant jurisdictions and across borders. Planning for infrastructure improvements to enable OSOM movements for wind projects should where possible be addressed through existing corridor planning activities, such as for the Sturt Highway, and identify opportunities for upgrades that support a range of beneficial outcomes.
Opportunities for policy action and regulatory reform to enable and optimise delivery
While physical infrastructure constraints have been the focus of our analysis in this report, through the research and our wide-ranging engagements with governments and industry, we have identified several opportunities for reform that go beyond infrastructure improvements.
These would address system-wide constraints and inefficiencies for delivery, reducing the time and cost of delivery, and in some cases help manage or reduce the capital infrastructure costs required.
Challenge | Opportunity |
Ports of entry for wind turbines and OSOM delivery routes are being planned by individual energy developers on a project-by-project basis.This approach makes it harder to understand cumulative demands, identify and manage where these may place excessive pressure on existing infrastructure capacity and prioritise action to tackle constraints that increase the risk of delays to the renewable energy roll-out.It also increases the time and costs of delivering wind projects, for example due to duplicative effort where each developer has to individually meet requirements such as OSOM route assessments, infrastructure planning and regulatory approvals. | Australian, state and territory governments should coordinate a national approach to:
|
OSOM movements to transport wind turbines have significant regulatory access, safety and compliance requirements, typically involving an individual application, assessment and permit process for each movement. These requirements can be complex and time-consuming, adding to the cost and time of energy projects, and be inconsistent across jurisdictions, creating inefficiencies and delays.As project delivery scales up, the administrative burdens associated with these processes will grow for governments and industry. | Australian, state and territory governments should coordinate a national approach to:
|
As the delivery task for wind turbine transport gathers pace, rapidly accelerating demand may put pressure on supply chain resources to gear up and deliver – including drivers, specialist vehicles, pilots and escorts.For example, reliance on police forces for OSOM escorts in some states and territories may put undue strain on police resources and may no longer be feasible, with potential to explore alternative solutions in use by other jurisdictions or harmonise rules where this can enable more efficient cross-border movements.There is also limited understanding of the current capacity of logistics operators in the market to respond to fast-growing demand for wind turbine transport across the country, which warrants further investigation to identify any potential shortfall and risks to delivery. | Australian, state and territory governments should coordinate a national approach to:
|
Energy project developers are pursuing increasingly bigger wind turbines, with longer blades that generate more energy, increase the range of viable locations for wind development and offer greater return on investment.The growing dimensions of turbine blades, towers and other components risks exponential increases in the impacts and costs to enabling infrastructure to transport these.67,68While wind farm development is subject to a range of standards or regulation (such as electrotechnical standards, noise limits and other environmental impacts, or requirements for grid connection) there is no standard for the design or size of large wind turbines. | Australian, state and territory governments, working with the clean energy industry, should coordinate a national approach to establish clear limits on the maximum dimensions of wind turbine components and associated vehicle configurations that can be transported on permissible delivery routes. This may be through regulatory, planning or other mechanisms but should offer certainty to industry on infrastructure limits, a basis to support streamlined access arrangements and help manage enabling infrastructure costs. Where possible, limits on dimensions should be nationally consistent but could be specified for individual road corridors according to the design, capacity, constraints and risks associated with each corridor. |
Growing demand for wind construction offers opportunities for Australia to develop local industries for manufacturing wind turbines.69Clean energy manufacturing is a priority area under the Australian Government’s Future Made in Australia agenda, with a recent consultation conducted on domestic manufacturing of wind and transmission infrastructure.70,71Depending on when manufacturing can be established and where it is located, this may reduce impacts and infrastructure requirements for OSOM movements of wind turbines. | The Australian Government should work with state and territory governments and industry to identify emerging opportunities to develop local industries for the domestic manufacture of wind turbine components, including tower sections, and consider:
|
Appendix A: Selected examples of government policies and initiatives to support net zero and the renewable energy transition
Jurisdiction | Targets | Policy Measures & Frameworks | Delivery & Market Enablers |
Commonwealth |
|
|
|
New South Wales |
|
|
|
Victoria |
|
|
|
Queensland |
|
|
|
Western Australia |
|
|
|
South Australia |
|
|
|
Tasmania |
|
|
|
Australian Capital Territory |
|
|
|
Northern Territory |
|
|
|
Appendix B: Methodology
Infrastructure Audit
This document has been delivered as an audit in accordance with section 5A of the Infrastructure Australia Act 2008 (Cth)
Analysis of wind project OSOM demand and constraints
Selection of wind projects
Infrastructure Australia’s Market Capacity Intelligence System was used to identify data on planned onshore wind projects. The data was filtered to exclude projects recently completed or under construction (as of July 2025) to produce a master dataset of approximately 150 projects. From this set, we selected projects based on:
- National priority status, represented by 21 onshore wind projects identified on the Australian Government National Renewable Energy Priority List (across all states and territories).
- Additional projects located in New South Wales, Victoria or Queensland, which represent the three largest energy-generating states.
- Proximity to declared or proposed Renewable Energy Zones (REZ) for projects in New South Wales and Victoria.
- Project delivery confidence–to exclude projects that, at the time of the analysis, were considered less certain to proceed to delivery. This was determined through a criteria-based probabilistic assessment of projects according to evidence regarding: planning status and progress through development approval processes; government support and/or priority designation for a project; and project financing status.
Calculation of OSOM movement volumes
Infrastructure Australia’s wind project data, together with data from individual wind project planning documentation (including environmental impact statements, transport impact assessments, route studies, or scoping reports) were used to derive and validate metrics needed to model OSOM movements.
These metrics included: project generation capacity (in MW); expected construction schedule (start and end quarters); the number of wind turbines; number of components per wind turbine requiring an OSOM delivery; and total number of OSOM movements.
Where actual metrics for numbers of turbines and OSOM movements could not be identified for projects, we adopted the following standard assumptions derived from our own analysis, and validated with agencies in jurisdictions performing similar analysis:
- Number of wind turbines – assumed to be the total generation capacity of the project (in MW) divided by 7.5.
- Total number of OSOM movements–assumed to be the number of wind turbines multiplied by 13.
An expected volume of OSOM movements per quarter was calculated by dividing the expected total number of OSOM movements by the number of construction quarters. This is translated into a daily OSOM movements figure by dividing by 65 (equivalent to five operational days a week).
Allocation of OSOM volumes to ports
For projects at more advanced stages of planning, project Environmental Impact Statements typically declared which port(s) the proponent intended to use. If a single port was declared as confirmed, then all OSOM volumes were allocated to this port (including where possible alternative ports are identified). If no primary port was declared, then OSOM volumes were allocated across any potential ports identified.
For projects in earlier stages of planning, several potential ports may be identified in scoping reports or in EPBC referral documents. In this case, OSOM volumes were allocated across any potential ports identified. In the absence of any potential ports being specified, a port of import was assumed based on ports used by other wind projects located in proximity to the relevant project.
Total OSOM volume demands for each port are derived from OSOM volumes allocated to routes originating from the port.
Determination of delivery routes
For projects at advanced stages of planning, information about potential or confirmed delivery routes was derived from planning documents such as transport impact and route assessments developed by proponents. In the absence of any potential or confirmed delivery routes, an OSOM delivery route was assumed based on routes determined by other wind projects located
in proximity.
Allocation of OSOM volumes to delivery routes
All captured delivery routes were assigned a priority on the following basis:
- Primary: declared as the preferred route by proponent. A project may have multiple primary routes, for instance for different turbine components (e.g., blades, tower sections).
- Alternative: a route separate from a project’s declared primary route(s), identified as an additional route option assessed or an alternate route to be used in the event of disruption to a primary route.
- Potential: no route(s) yet declared as preferred, but options had been put forward.
- Assumed: no available route information exists. In these cases, a route was assumed based on routes determined by other wind projects located in proximity.
OSOM volumes per quarter and per day were allocated to delivery routes based on their priority:
- Allocated equally to all primary route(s) if they existed.
- Otherwise, allocated equally to all potential route(s) if they existed.
- Otherwise, allocated equally to all assumed route(s).
Routes identified as alternative routes were not allocated OSOM volumes in the analysis.
Identification of road infrastructure constraints
For projects that were advanced in their planning approvals, proponents may have identified road access constraints at ports and along delivery routes in their environmental impact statements, transport impact assessments or route studies.
Constraints relevant to OSOM movements were captured, where these:
- Had a specific location defined or that could be identified through desktop research.
- Were relevant to OSOM movements out of a port or on the freight network (i.e., were not related to project site access).
- Indicated a need for infrastructure intervention to address the constraint (i.e., excluding potential constraints identified but considered to require no action, or that could be resolved through traffic management or other operational solutions – such as the use of spotters or travel over the other side of the road).
The following information about each constraint was captured:
- Location of the constraint, including latitude and longitude, and level of spatial accuracy.
- Category (width, height, mass or pavement) and subcategory (e.g. bridge height, intersection width, unsealed road).
- If the proponent had presented the constraint as confirmed or only a potential constraint.
Analysis based on this data was then tested and validated through extensive engagement with government and industry stakeholders.
Limitations of our analysis
Our analysis includes known limitations. Where possible, we have sought to mitigate them through validating data and insights with government and industry stakeholders, and work conducted with consultants.
- Our analysis was based on Infrastructure Australia’s Market Capacity wind project data that was current as of July 2025, and other publicly available data sourced from project websites or government planning portals, between July and December 2025. Project timeframes, scope and delivery routes may have been changed since the analysis was completed.
- The availability of public data on wind projects, such as planning documentation, varies between jurisdictions.
- The scope of our analysis focuses on jurisdictions with the greatest expected demand, as well as renewable energy zones.
- As a result, our analysis provides a partial view of expected demand, which is underrepresented for
some jurisdictions. - Our analysis of demand volumes presents an unconstrained view of demand based on proponent plans. Actual demand over time may be different based on a range of factors.
- There is no standardised approach for how route assessments are conducted. This leads to inconsistencies in the scope of the assessment, the level of detail provided, and how information on routes and constraints are reported.
Glossary
Term | Definition | Term | Definition |
Australian Energy Market Operator (AEMO) | An independent organisation that manages the day to day operations of electricity and gas systems and markets across Australia. | Over-size, over-mass (OSOM) vehicles / movements | Over-size, over-mass (OSOM) vehicles and movements are specialised heavy vehicles used to transport large or heavy loads that exceed standard mass and/or dimension limits for road freight. These vehicles are defined under the Heavy Vehicle National Law as Class 1 (load carrying vehicles). |
Berth | A designated space in a port where a vessel can dock to load or unload cargo, carry out maintenance or perform other operations. | Renewable Energy Zone (REZ) | Areas identified by AEMO, or proposed or declared by state and territory governments, as regions with strong renewable energy resources and coordinated planning of renewable energy generation, transmission and storage infrastructure development. |
Grid-scale / utility-scale | Refers to electricity generation, transmission and/or distribution systems that have capacity large enough to supply power to a regional or national electricity grid. | South West Interconnected System (SWIS) | The SWIS is Western Australia’s main electricity network which serves most of the state’s population. |
Laydown area | A designated, open-air storage area used to temporarily hold, sort, or assemble bulky cargo, equipment, and materials before they are shipped out or transported inland. | Transformers | An electrical component used to convert the voltage of electricity generated by a wind turbine to a level suitable for transmission or distribution on the power grid. |
Nacelle | A large enclosure mounted at the top of a wind turbine tower, behind the blades, which contains key mechanical and electrical components that allow the turbine to generate electricity. | Tower | A tall vertical structure that supports the nacelle and blades of a wind turbine. |
National Electricity Market (NEM) | The NEM is a wholesale market through which generators and retailers trade electricity in Australia. It interconnects the six eastern and southern states and territories and delivers around 80% of all electricity consumption in Australia. | Turbine / Wind turbine | A machine that converts the energy of moving air (wind) into electrical energy by using rotating blades connected to a generator. |
Endnotes
- Commonwealth of Australia n.d., Rewiring the Nation, Department of Climate Change, Energy, the Environment and Water, Canberra, accessed 4 July 2026. Available via: https://www.dcceew.gov.au/energy/renewable/rewiring-the-nation
- Commonwealth of Australia n.d., Capacity Investment Scheme, Department of Climate Change, Energy, the Environment and Water, Canberra, accessed 4 July 2026. Available via: https://www.dcceew.gov.au/energy/renewable/capacity-investment-scheme
- Commonwealth of Australia n.d., Environment protection reforms, Department of Climate Change, Energy, the Environment and Water, Canberra, accessed 4 July 2026. Available via: https://www.dcceew.gov.au/environment/epbc/epbc-act-reform
- Infrastructure Australia 2025, Infrastructure Market Capacity 2025 Report. Infrastructure Australia, Sydney. Available via: https://www.infrastructureaustralia.gov.au/2025-infrastructure-market-capacity-report
- Commonwealth of Australia 2025, Australia’s Net Zero Transformation: Treasury Modelling and Analysis, Treasury, Canberra, p.16, Available via: https://treasury.gov.au/sites/default/files/2025-11/p2025-700922.pdf
- Commonwealth of Australia 2025, Electricity and Energy Sector Plan, Department of Climate Change, Energy, the Environment and Water, Canberra, p.1. Available via: https://www.dcceew.gov.au/sites/default/files/documents/electricity-energy-sector-plan-2025.pdf
- Commonwealth of Australia 2025, Australia’s Net Zero Transformation: Treasury Modelling and Analysis, Treasury, Canberra, p.20. Available via: https://treasury.gov.au/sites/default/files/2025-11/p2025-700922.pdf
- Commonwealth of Australia 2025, Australia’s Net Zero Transformation: Treasury Modelling and Analysis, Treasury, Canberra, p.21. Available via: https://treasury.gov.au/sites/default/files/2025-11/p2025-700922.pdf
- Commonwealth of Australia 2025, Electricity and Energy Sector Plan, Department of Climate Change, Energy, the Environment and Water, Canberra, p.40. Available via: https://www.dcceew.gov.au/sites/default/files/documents/electricity-energy-sector-plan-2025.pdf
- Commonwealth of Australia 2025, Electricity and Energy Sector Plan, Department of Climate Change, Energy, the Environment and Water, Canberra, p.43. Available via: https://www.dcceew.gov.au/sites/default/files/documents/electricity-energy-sector-plan-2025.pdf
- AEMO 2025, Draft 2026 Integrated System Plan Overview, Australian Energy Market Operator, accessed 8 May 2026. Available via: https://www.aemo.com.au/consultations/current-and-closed-consultations/draft-2026-isp-consultation
- AEMO 2025, Draft 2026 Integrated System Plan Overview, Australian Energy Market Operator, accessed 8 May 2026. Available via: https://www.aemo.com.au/consultations/current-and-closed-consultations/draft-2026-isp-consultation
- Infrastructure Australia 2025, Infrastructure Market Capacity 2025 Report. Infrastructure Australia, Sydney. Available via: https://www.infrastructureaustralia.gov.au/2025-infrastructure-market-capacity-report
- Commonwealth of Australia 2025, Australia’s Net Zero Transformation: Treasury Modelling and Analysis, Treasury, Canberra, p.20. Available via: https://treasury.gov.au/sites/default/files/2025-11/p2025-700922.pdf
- AEMO 2025, 2026 Draft Integrated System Plan, ISP generation and storage outlook, ‘Step Change – Core’ scenario. Australian Energy Market Operator, Melbourne. Available via: https://www.aemo.com.au/consultations/current-and-closed-consultations/draft-2026-isp-consultation
- AEMO 2025, 2025 Draft Integrated System Plan, ISP generation and storage outlook, ‘Step Change – Core’ scenario. Australian Energy Market Operator. Available via: https://www.aemo.com.au/consultations/current-and-closed-consultations/draft-2026-isp-consultation
- Commonwealth of Australia 2025, National Renewable Energy Priority List, Department of Climate Change, Energy, the Environment and Water, Canberra, accessed 15 November 2025. Available via: https://www.dcceew.gov.au/energy/renewable/priority-list
- NSW Department of Climate Change, Energy, the Environment and Water, 2020, Electricity Infrastructure Roadmap, NSW DCCEEW, accessed 27 May 2026. Available via: https://www.energy.nsw.gov.au/nsw-plans-and-progress/major-state-projects/electricity-infrastructure-roadmap
- ASL, 2025, 2025 Infrastructure Investment Objectives Report, ASL, Sydney. Available via: https://asl.org.au/-/media/services/files/publications/iio-report/2025/2025-iio-report.pdf
- VicGrid 2025, Victorian Transmission Plan, VicGrid, Melbourne, Available via: https://www.vicgrid.com.au/transmission-planning/victorian-transmission-plan
- Queensland Treasury, 2025, Energy Roadmap, The State of Queensland (Queensland Treasury), Brisbane, Available via: https://www.treasury.qld.gov.au/files/Queensland-Energy-Roadmap-2025-25-043.pdf
- Commonwealth of Australia, 2024, Pilbara Ports Common User Upgrades, Federation Funding Agreement – Infrastructure, Australian Government, Canberra, accessed 9 July 2026. Available via: https://federalfinancialrelations.gov.au/agreements/pilbara-ports-common-user-upgrades
- Mid West Ports 2025, Geraldton Port Maximisation Project (PMaxP), Mid West Ports Authority, Geraldton, accessed 26 May 2026. Available via: https://www.midwestports.com.au/development/projects/geraldton-port-maximisation-project-pmaxp.aspx
- Commonwealth of Australia 2020, National Land Transport Network Determination 2020, Department of Infrastructure, Transport, Regional Development, Communications, Sport and the Arts, Canberra, accessed 9 July 2026. Available via: https://www.legislation.gov.au/F2020L00851/latest/text
- Commonwealth of Australia 2022, National Key Freight Routes Map, Department of Infrastructure, Transport, Regional Development, Communications, Sport and the Arts, Canberra, accessed 27 May 2026. Available via: https://catalogue.data.infrastructure.gov.au/dataset/national-key-freight-routes-map
- NSW Government 2023, NSW Network Infrastructure Strategy, EnergyCo, Sydney, p.35. Available via: https://www.energyco.nsw.gov.au/sites/default/files/2023-05/network-infrastructure-strategy.pdf
- Transport for NSW 2026, Singleton Bypass – New England Highway, Transport for NSW, Sydney, accessed 18 August 2026. Available via: https://www.transport.nsw.gov.au/projects/current-projects/singleton-bypass-new-england-highway
- NSW Government n.d., South West REZ Access Scheme, EnergyCo, Sydney, accessed 29 October 2025. Available via: https://www.energyco.nsw.gov.au/industry/access-schemes/south-west-rez-access-scheme
- Nick Canto and Roderick Hetherington, Port to Project Logistics for Wind Farms. A Practical Assessment of Impacts on Transport Infrastructure, icubed consulting, Melbourne. Available via: https://icubed.com.au/wp-content/uploads/2023/02/Port-to-Project-Logistics-for-Wind-Farms.-A-Practical-assessment-of-Impacts-on-Transport-Infrastructure-1.pdf
- QTLC, 2023, Review of Oversize Overmass Wind Farm Arrangements, Queensland Transport and Logistics Council, Brisbane, p.5. Available via: https://www.qtlc.com.au/wp-content/uploads/2024/01/Pastin-Report-OSOM-Windfarm.pdf
- Transport for NSW 2025, Renewables Transportation – Port to Renewable Energy Zones, Transport for NSW, Sydney, accessed 8 November 2025. Available via: https://www.transport.nsw.gov.au/projects/current-projects/renewables-transportation-%E2%80%93-port-to-renewable-energy-zones-rez
- Squadron Energy 2025, First components arrive at port for Uungula Wind Farm, accessed 20 August 2026. Available via: https://squadronenergy.com/news/first-components-arrive-at-port-for-uungula-wind-farm/
- Port of Newcastle 2020, Port of Newcastle a powerful link for renewable energy in NSW, accessed 20 August 2026. Available via: https://pon.com.au/news/port-of-newcastle-a-powerful-link-for-renewable-energy-in-nsw/
- Commonwealth of Australia 2025, National Freight and Supply Chain Strategy, Department of Infrastructure, Transport, Regional Development, Communications, Sport and the Arts, Canberra, accessed 9 July 2026. Available via: https://www.freightaustralia.gov.au/sites/default/files/documents/national-freight-supply-chain-strategy-2025.pdf
- Commonwealth of Australia 2023, Australian Sea Freight 2020-21, Bureau of Infrastructure and Transport Research Economics (BITRE), Department of Infrastructure, Transport, Regional Development, Communications and the Arts, Canberra. Available via: https://www.bitre.gov.au/sites/default/files/documents/Australian%20Sea%20Freight%202020-21.pdf
- House of Representatives Standing Committee on Regional Development, Infrastructure and Transport 2023, Inquiry into the implications of severe weather events on the national regional, rural, and remote road network, Parliament of Australia, Canberra. Available via: https://parlinfo.aph.gov.au/parlInfo/download/committees/reportrep/RB000033/toc_pdf/Inquiryintotheimplicationsofsevereweathereventsonthenationalregional,rural,andremoteroadnetwork.pdf
- Nick Canto and Roderick Hetherington, 2023, Port to Project Logistics for Wind Farms. A Practical Assessment of Impacts on Transport Infrastructure, icubed consulting, Melbourne, accessed 5 November 2025. Available via: https://icubed.com.au/wp-content/uploads/2023/02/Port-to-Project-Logistics-for-Wind-Farms.-A-Practical-assessment-of-Impacts-on-Transport-Infrastructure-1.pdf
- NSW Ports, 2023, NSW Ports 2063, NSW Ports, Sydney, p.53. Available via: https://www.nswports.com.au/NSWPorts-Master-Plan
- Productivity Commission 2026, Impacts of heavy vehicle reform: Interim report, Productivity Commission, Canberra. Available via: https://www.pc.gov.au/inquiries-and-research/heavy-vehicle-reform/interim/
- Safe Work Australia, 2020, Guide to transporting high loads near electrical lines, Safe Work Australia, Canberra. Available via: https://www.safeworkaustralia.gov.au/system/files/documents/1703/guide-transporting-high-loads.pdf
- Re-Alliance, 2025, How Australia’s shift to renewable energy can deliver beneficial outcomes for regional housing, Re-Alliance, Black Hill. Available via: https://www.re-alliance.org.au/housing_case_studies_report
- Community Power Agency & Orange Compass, 2023, Short-term worker accommodation with long-term community benefits, Community Power Agency & Orange Compass, Sydney. Available via:https://www.orangecompass.com.au/images/Discussion_Paper_Short_term_accommodation_long_term_benefits.pdf
- Re-Alliance, 2025, How Australia’s shift to renewable energy can deliver beneficial outcomes for regional housing, Re-Alliance, Black Hill. Available via: https://www.re-alliance.org.au/housing_case_studies_report
- National Heavy Vehicle Regulator n.d., Oversize Overmass, NHVR, Brisbane, accessed 18 November 2025. Available via: https://www.nhvr.gov.au/road-access/access-management/applications/oversize-overmass
- Commonwealth of Australia 2025, Update on National Automated Access System, May 2025 Statement, Department of Infrastructure, Transport, Regional Development, Communications and the Arts, Canberra. Available via: https://www.infrastructure.gov.au/sites/default/files/documents/may-2025-statement-update-on-national-automated-access-system.pdf
- Productivity Commission 2026, Impacts of heavy vehicle reform: Interim report, Productivity Commission, Melbourne, accessed 9 July 2026. Available via: https://www.pc.gov.au/inquiries-and-research/heavy-vehicle-reform/interim/
- National Heavy Vehicle Regulator 2025, Pilot and escort recognition and training – Information sheet, NHVR, Brisbane. Available via: https://www.nhvr.gov.au/files/media/document/229/202603-0902-pilots-and-escort-training-and-recognition.pdf
- Infrastructure SA 2025, South Australia’s 20-Year State Infrastructure Strategy 2025, Infrastructure SA, Adelaide, p.68. Available via: https://www.infrastructure.sa.gov.au/__data/assets/pdf_file/0011/1139735/ISA-20-Year-State-Infrastructure-Strategy-2025-Web.pdf
- Queensland Transport and Logistics Council, 2023, Review of Oversize Overmass Wind Farm Arrangements, QTLC, Brisbane, p.28. Available via: https://www.qtlc.com.au/wp-content/uploads/2024/01/Pastin-Report-OSOM-Windfarm.pdf
- National Heavy Vehicle Regulator, 2025, Submission on Impacts of Heavy Vehicle Reform, Productivity Commission, NHVR, Brisbane. Available via: https://assets.pc.gov.au/2026-01/sub004-heavy-vehicle-reform.pdf?VersionId=VRLcNDWIlxb6ThnUqSihEFmmENDKintt
- National Heavy Vehicle Regulator 2025, Pilot and escort recognition and training – Information sheet, NHVR, Brisbane. Available via: https://www.nhvr.gov.au/files/media/document/229/202603-0902-pilots-and-escort-training-and-recognition.pdf
- Australian Logistics Council, 2025 Core Skills Occupation List – A submission to Jobs and Skills Australia, ALC, Leichhardt. Available via: https://austlogistics.com.au/wp-content/uploads/2025/09/250926-2025-Core-Skills-Occupation-List-.pdf
- Australian Logistics Council, 2025, Impacts of Heavy Vehicle Reform – A submission to the Productivity Commission, ALC, Leichhardt. Available via: https://austlogistics.com.au/wp-content/uploads/2025/12/Submission-251219-Impacts-of-HV-Reform.pdf
- Productivity Commission 2026, Impacts of heavy vehicle reform: Interim report, Productivity Commission, Melbourne, accessed 9 July 2026. Available via: https://www.pc.gov.au/inquiries-and-research/heavy-vehicle-reform/interim/
- Clean Energy Council, 2018, Enhancing Positive Social Outcomes from Wind Farm Development: Evaluating Community Engagement and Benefit Sharing in Australia, Clean Energy Council, Melbourne, accessed 6 November 2025. Available via: https://assets.cleanenergycouncil.org.au/documents/resources/reports/enhancing-positive-social-outcomes-from-wind-farm-development.pdf
- Civil Aviation Safety Authority, 2025, Summary of Consultation - Draft Multi-Part AC 139.E-01 and AC 175.E-02 - Version 2.0 - Objects and structures that affect aviation safety, CASA, Canberra. Available via: https://consultation.casa.gov.au/regulatory-program/mp-ac-139-e-01-and-ac-175-e-02-v2-0/results/socondraftmulti-partac139.e-01andac175.e-02-version2.0.pdf
- Queensland Transport and Logistics Council, 2023, Review of Oversize Overmass Wind Farm Arrangements, Queensland Transport and Logistics Council, Brisbane, p.27. Available via: https://www.qtlc.com.au/wp-content/uploads/2024/01/Pastin-Report-OSOM-Windfarm.pdf
- Gladstone Ports Corporation 2025, Registration of Interest: Container Terminal Development Opportunity, Gladstone Ports Corporation, Gladstone. Available via: https://www.engagegpc.com.au/gladstone-container-terminal-opportunity
- Gladstone Ports Corporation n.d., Northern Land Expansion Project, Gladstone Ports Corporation, Gladstone, viewed 9 July 2026. Available via: https://gpcl.com.au/ports-and-trade/major-projects/northern-land-expansion/
- Gladstone Ports Corporation, 2019, Gatcombe and Golding Cutting Channel Duplication Project: Revised Draft Environmental Impact Statement – Chapter 1, Gladstone Ports Corporation, Gladstone. Available via: https://eisdocs.dsdip.qld.gov.au/Port%20of%20Gladstone%20Gatcombe%20and%20Golding%20Cutting%20Channel%20Duplication/AEIS/chapter-1-introduction-25-september-19.pdf
- Bundaberg Regional Council 2025, Support for Port of Bundaberg project, Bundaberg Regional Council, Bundaberg, accessed 26 May 2026. Available via: https://www.brcnow.bundaberg.qld.gov.au/2025/10/01/support-for-port-of-bundaberg-project/
- Cambray Consulting 2024, Theodore Wind Farm – Preliminary Route Assessment Report, Cambray Consulting, Brisbane. Available via: https://au.rwe.com/-/media/RWE/RWE-Australia/documents/theodore/reports/preliminary-route-assessment-report.pdf#:~:text=Due%20to%20the%20limitation%20of%20bridge%20clearance,alternative%20route%20is%20summarised%20in%20Table%202.4
- Williamson R 2025, Tight squeezes and tricky turns: The tortuous path of transporting giant wind turbines. Renew Economy article, 23 October 2025. Available via: https://reneweconomy.com.au/tight-squeezes-and-tricky-turns-the-tortuous-path-of-transporting-giant-wind-turbines/
- Cambray Consulting 2024, Theodore Wind Farm – Preliminary Route Assessment Report, Cambray Consulting, Brisbane. Available via: https://au.rwe.com/-/media/RWE/RWE-Australia/documents/theodore/reports/preliminary-route-assessment-report.pdf#:~:text=Due%20to%20the%20limitation%20of%20bridge%20clearance,alternative%20route%20is%20summarised%20in%20Table%202.4
- GeelongPort 2024, Port Development Strategy, GeelongPort, Geelong. Available via: https://geelongport.com.au/development/port-development-strategy/
- GeelongPort n.d., Geelong Renewables Terminal, GeelongPort, Geelong, accessed 17 June 2026. Available via: https://geelongport.com.au/development/geelong-renewables-terminal/
- US Department of Energy 2024, Wind Turbines: the Bigger, the Better. Office of Energy Efficiency and Renewable Energy, Washington, accessed 5 November 2025. Available via: https://www.energy.gov/eere/articles/wind-turbines-bigger-better
- icubed consulting 2023, Port to Project Logistics for Wind Farms: A Practical Assessment of Impacts on Transport Infrastructure, icubed consulting, Milton. Available via: https://icubed.com.au/wp-content/uploads/2023/02/Port-to-Project-Logistics-for-Wind-Farms.-A-Practical-assessment-of-Impacts-on-Transport-Infrastructure-1.pdf
- The Centre for Future Work 2024, An Industrial Strategy for Domestic Manufacturing of Onshore and Offshore Wind Energy Towers and Equipment, The Australia Institute, Canberra. Available via: https://futurework.org.au/report/an-industrial-strategy-for-domestic-manufacturing-of-onshore-and-offshore-wind-energy-towers-and-equipment/
- National Reconstruction Fund Corporation 2024, Investment guidance, National Reconstruction Fund, Canberra. Available via: https://www.nrf.gov.au/sites/default/files/documents/2024-01/investment-guidance.pdf
- Commonwealth of Australia 2026, Consultation Guidance: Domestic manufacturing of wind and transmission infrastructure. Department of Industry, Science and Resources, Canberra, accessed 9 July 2026. Available via: https://consult.industry.gov.au/domestic-manufacturing-of-wind-and-transmission-infrastructure

