
Annual Performance Statement 2026
1 April 2026
Introduction
Introduction
Infrastructure Australia is the Australian Government’s independent adviser on nationally significant infrastructure investment planning and prioritisation. Sectors within Infrastructure Australia’s remit comprise transport, energy, communications, water, and social infrastructure.1
Purpose of this Statement
This document delivers on the requirement in section 5DB of the Infrastructure Australia Act 2008 (IA Act) that Infrastructure Australia must give to the Minister and table in both Houses of Parliament each financial year:
- an annual performance statement (the Statement or the Performance Statement) on the performance outcomes being achieved by states, territories and local government authorities in relation to the infrastructure investment program and existing project initiatives funded by the Commonwealth; and
- an annual budget statement to inform the Commonwealth’s budget process on infrastructure investment.
_____
- Social infrastructure is generally considered in the context of a broader infrastructure development proposal that includes integrated investments in other infrastructure and contained in place or region-based infrastructure planning.
Analysis of the Australian Government’s program of infrastructure investments
Analysis of the Australian Government’s program of infrastructure investments
This Statement reports on the performance outcomes being achieved by states, territories and local government authorities in relation to the infrastructure investment program and existing project initiatives funded by the Australian Government, across Infrastructure Australia’s sectoral remit.
The Australian Government provides funding for state and territory infrastructure projects through two main mechanisms: grant programs and the Federal Financial Relations (FFR) system. This Statement provides analysis of the performance of Australian Government funding of infrastructure projects under the FFR system. It excludes analysis of Australian Government investments through equity, loans and special purpose vehicles to Government Business Enterprises and private sector entities.2
Criteria used to identify in-scope projects
As Infrastructure Australia’s remit is nationally significant infrastructure across transport, energy, water, communications and social infrastructure sectors, this Statement focuses on a subset of Australian infrastructure projects that meet defined criteria.
A project defined as in-scope for Performance Statement analysis:
- is part of the infrastructure sectoral Federation Funding Agreements (FFA)
- is an individual, nationally significant project (i.e., does not form part of a funding package and/or funding program)
- includes an Australian Government funding contribution or commitment over $250 million
- is funded in the Federal Budget
- is in the transport, energy, communications, water, or social infrastructure sectors
- has been or is expected to be evaluated by Infrastructure Australia.
Projects completed before May 2022 in the FFA Schedule for Land Transport Infrastructure Projects are excluded from analysis.3
Projects meeting the criteria above were identified in the infrastructure sectoral FFAs from the following FFA schedules:
- Land Transport Infrastructure Projects (2024-2029)
- National Water Grid Fund
- Pilbara Ports Common User Upgrades
- Perth City Deal.
Projects that do not meet the above criteria are excluded from analysis. Therefore, the Performance Statement does not analyse all the Australian Government’s infrastructure investments.
How the Statement corresponds with the 10-year Infrastructure Investment Program, Infrastructure Portfolio Budget Statements and MYEFO
While the majority of in-scope projects analysed as part of the Statement are in the Australian Government’s 10-year Infrastructure Investment Program (IIP), there are in-scope projects that are not in the IIP, such as those in other portfolios, like water.
Likewise, the Statement does not correspond with the Infrastructure, Transport, Regional Development, Communications, Sport and the Arts Portfolio Budget Statements. This is because Infrastructure Australia’s remit includes sectors outside of this portfolio.
The Statement uses project data available from the 2025–26 Federal Budget (and previous Budgets), as this is the Australian Government’s main financial report outlining Australia’s economic and fiscal outlook. The analysis has not considered new projects, or changes to existing projects, arising in the 2025 Mid-Year Economic and Fiscal Outlook (MYEFO) or other financial reporting.
Summary of in-scope projects
This year’s analysis is based on data provided on 81 projects, comprising 78 transport infrastructure projects, 2 water infrastructure projects, and 1 social infrastructure project that meet the defined criteria.4
For in-scope projects, Infrastructure Australia analysed:
- project attributes, including sector, project status, and funding sources
- changes in time and costs between the 2024–25 and 2025–26 Federal Budget papers.
Nine projects within the dataset have not been evaluated for time and cost changes, as they represent new commitments in Budget 2025–26 and were not part of previous budget data.5
The following analysis relates to in-scope projects only and therefore provides a subsection of the Australian Government’s infrastructure investment. It does not look at or analyse delivery of the Australian Government’s full program of infrastructure investments.
Figure 1: Performance outcomes analysis - summary of key findings
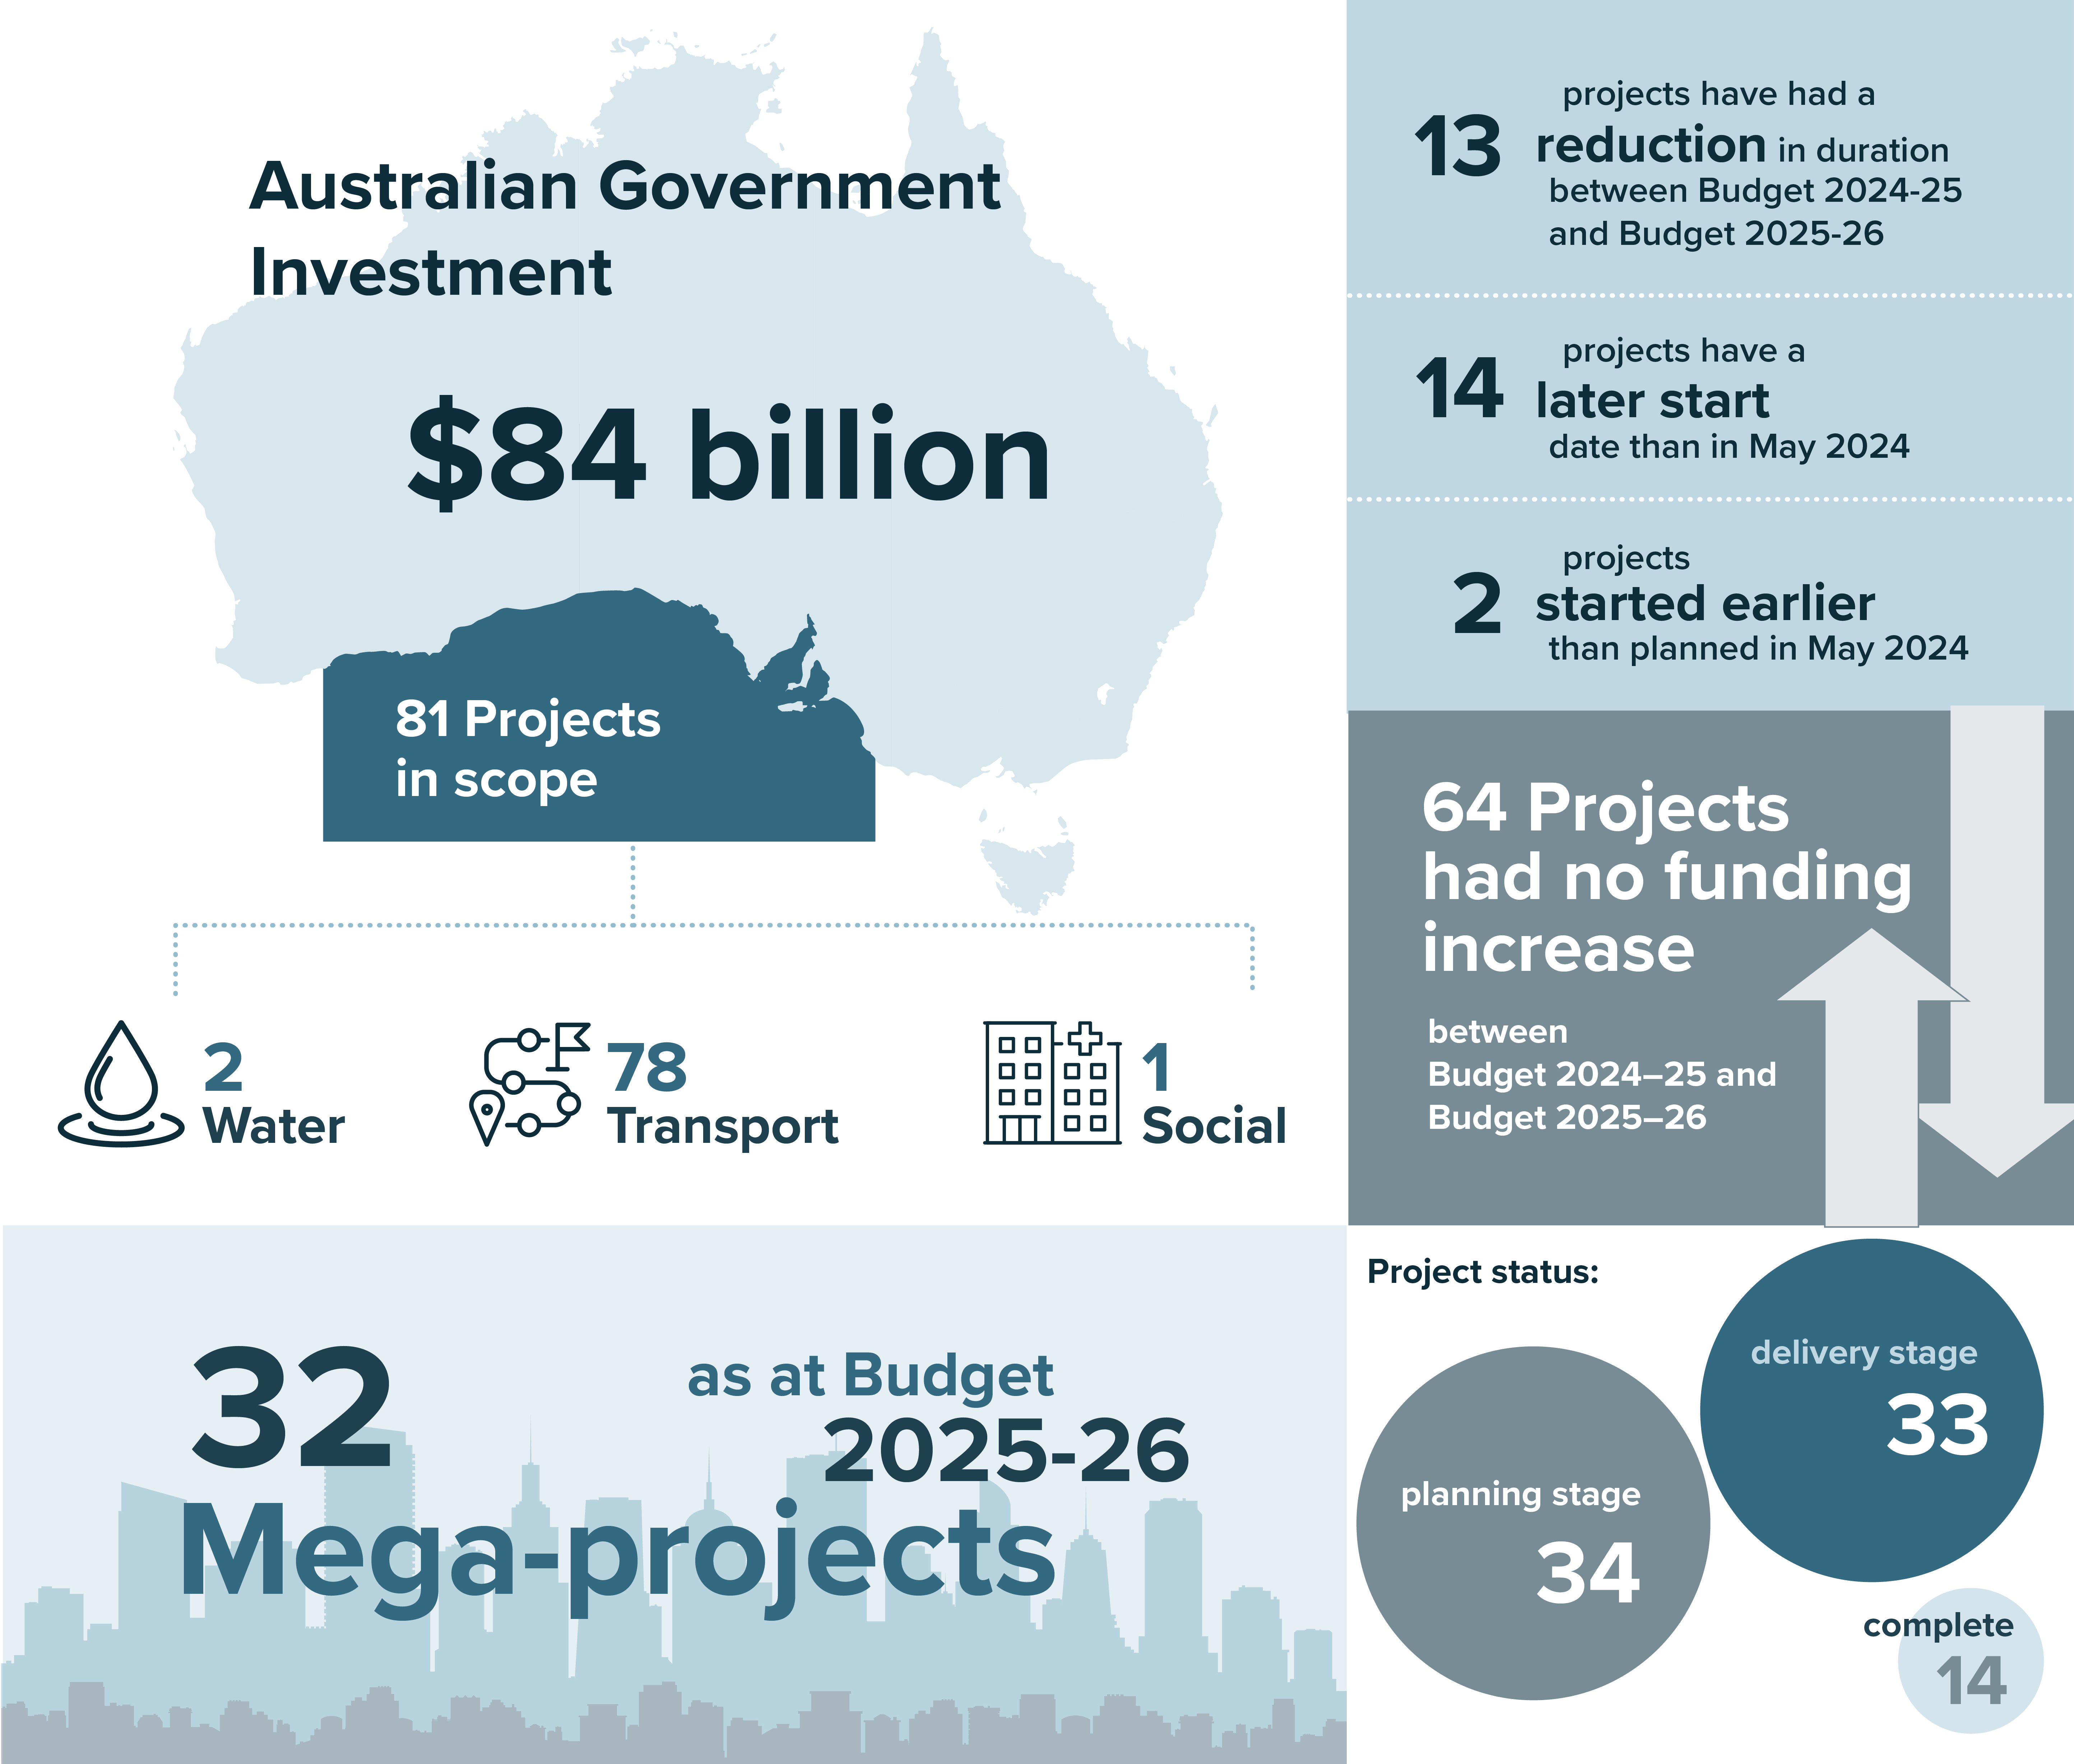
Performance outcomes analysis - key findings
The 2026 Performance Statement indicates greater stability in the cost and schedule performance of the Australian Government’s nationally significant infrastructure investments.
Of the 81 in-scope projects funded in Budget 2025–26, a majority (64 projects or 65% of total value of projects) had no change in total project cost. Six projects increased in cost between Budget 2024–25 and Budget 2025–26, compared to the 2025 Performance Statement, which showed 31 projects increased in project cost between Budget 2023–24 and Budget 2024–25.
This year’s Performance Statement shows a clear shift in cost-escalation trends.
Most project cost increases were below 25%, whereas last year’s Statement showed most project cost increases exceeded 25%.
The reduction in project cost increases translated into fewer funding increases for the Australian Government.
Australian Government funding increased for 4 out of the 6 projects with total project cost increases, with the Australian Government funding a 38% share. All up, Australian Government funding for the 72 projects reported in last year’s Statement increased by less than 1%.
Fewer cost increases allows unallocated funding to be directed toward new infrastructure commitments.
The 2026 Performance Statement reports a growing number of in-scope projects and Australian Government investment with:
- Nine new projects added to the Performance Statement dataset in Budget 2025–26 (7 road and 2 rail projects), versus 4 new projects in Budget 2024–25
- Megaprojects growing to 32 projects in Budget 2025–26 from 26 in Budget 2024–256
- Australian Government funding rising to $84 billion over 81 projects in Budget 2025–26 from $70 billion over 72 projects in Budget 2024–25
- Of the $14 billion in new Australian Government funding for in-scope projects in Budget 2025–26, $13.4 billion went to funding new projects.
As the Performance Statement only analyses a subset of projects in the Australian Government’s infrastructure investment program, these figures do not necessarily reflect the full scope of Australian Government funding in infrastructure overall.
Correlating with easing cost pressure is better schedule performance.
The reported project schedules were more stable in Budget 2025–26 (69% of projects by value with no change to time-to-completion), compared to Budget 2024–25 (48% of projects by value with no change to time-to-completion).
Project cost pressures may have eased for several reasons, including macroeconomic factors and project-specific drivers.7 The improved cost performance observed in the 2026 Performance Statement could also be influenced by the Australian Government’s reforms to infrastructure decision-making.
The 2023 Independent Strategic Review of the Infrastructure Investment Program and 2023 Independent Review of the National Partnership Agreement on Land Transport Infrastructure Projects made several recommendations to improve the management of the infrastructure project investment portfolio. Many of those recommendations have been operationalised by, for example, the FFA Schedule on Land Transport Infrastructure Projects (2024–2029) and the Infrastructure Policy Statement.
Australian Government’s reforms to infrastructure decision making
In 2023, the Australian Government reshaped the IIP following two major reviews: the Infrastructure Investment Program Strategic Review (the Strategic Review) and the Independent Review of the National Partnership Agreement on Land Transport Infrastructure Projects (the Halton Review).
The Strategic Review found the pipeline was unsustainable, with significant cost pressures, inconsistent governance, and many projects lacking a clear national rationale or credible planning and costings. It recommended annual 10-year state infrastructure plans, stronger and earlier gateway assurance processes, improved cost escalation methods, a 50:50 funding split between Australian and state and territory governments, rolling programs targeted toward nationally significant outcomes, and reviewing the National Land Transport Act 2014.
Additionally, the Halton Review reinforced the need for disciplined investment decisions through a structured two-pass process and strengthened risk-based governance.
Together, the recommendations of these reviews underpin the Government’s reform package. The Infrastructure Policy Statement now provides a strategic framework for assessing national significance and alignment with long-term planning priorities. The FFA Schedule for Land Transport Infrastructure Projects (2024–2029) and the associated 2025 Notes on Administration, which replaced the National Partnership Agreement, embed the two-pass process, enhanced gateway assurance requirements, and the Confidence Index. These measures are helping to improve cost stability as observed by the 2026 Performance Statement in Budget 2025–26.
Analysis of project attributes
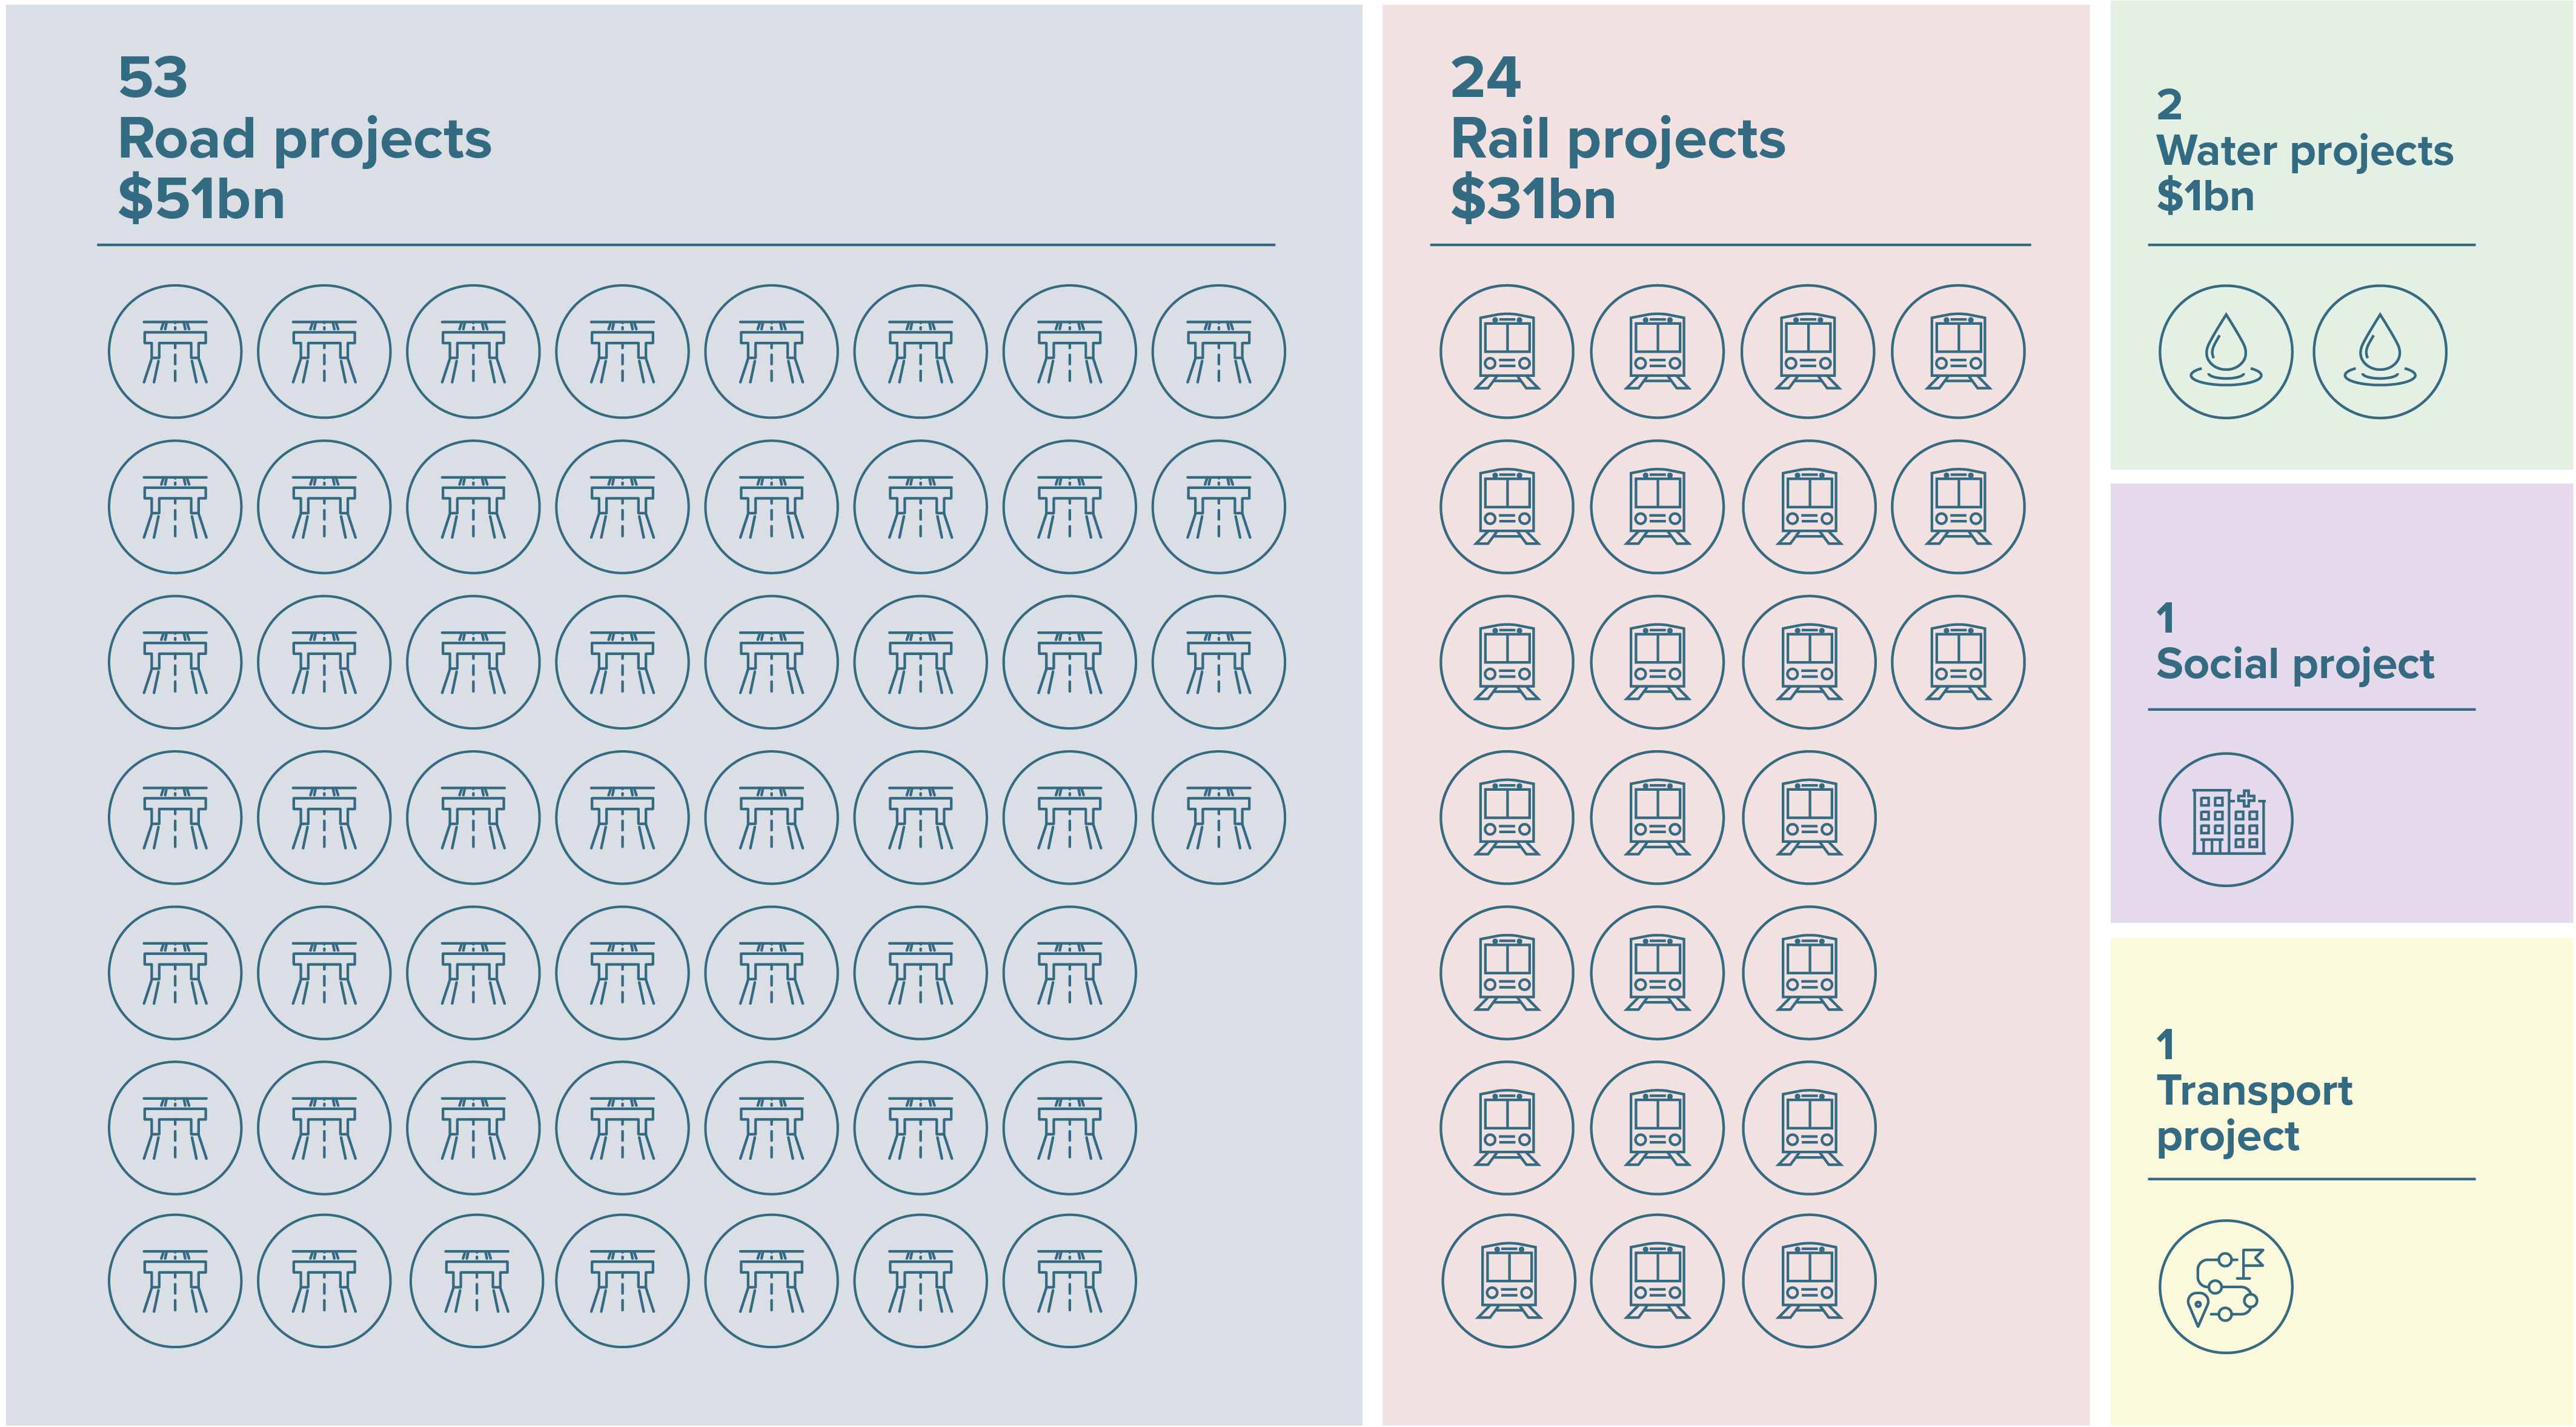
Road and rail infrastructure projects represent the majority of Australian Government funding for the in-scope dataset, accounting for 61% ($51 billion) and 37% ($31 billion), respectively. Water projects are 1% of Australian Government investment, as are Social and Transport-multimodal projects combined.
Figure 2: Projects analysed by sector, count and by Australian Government investment
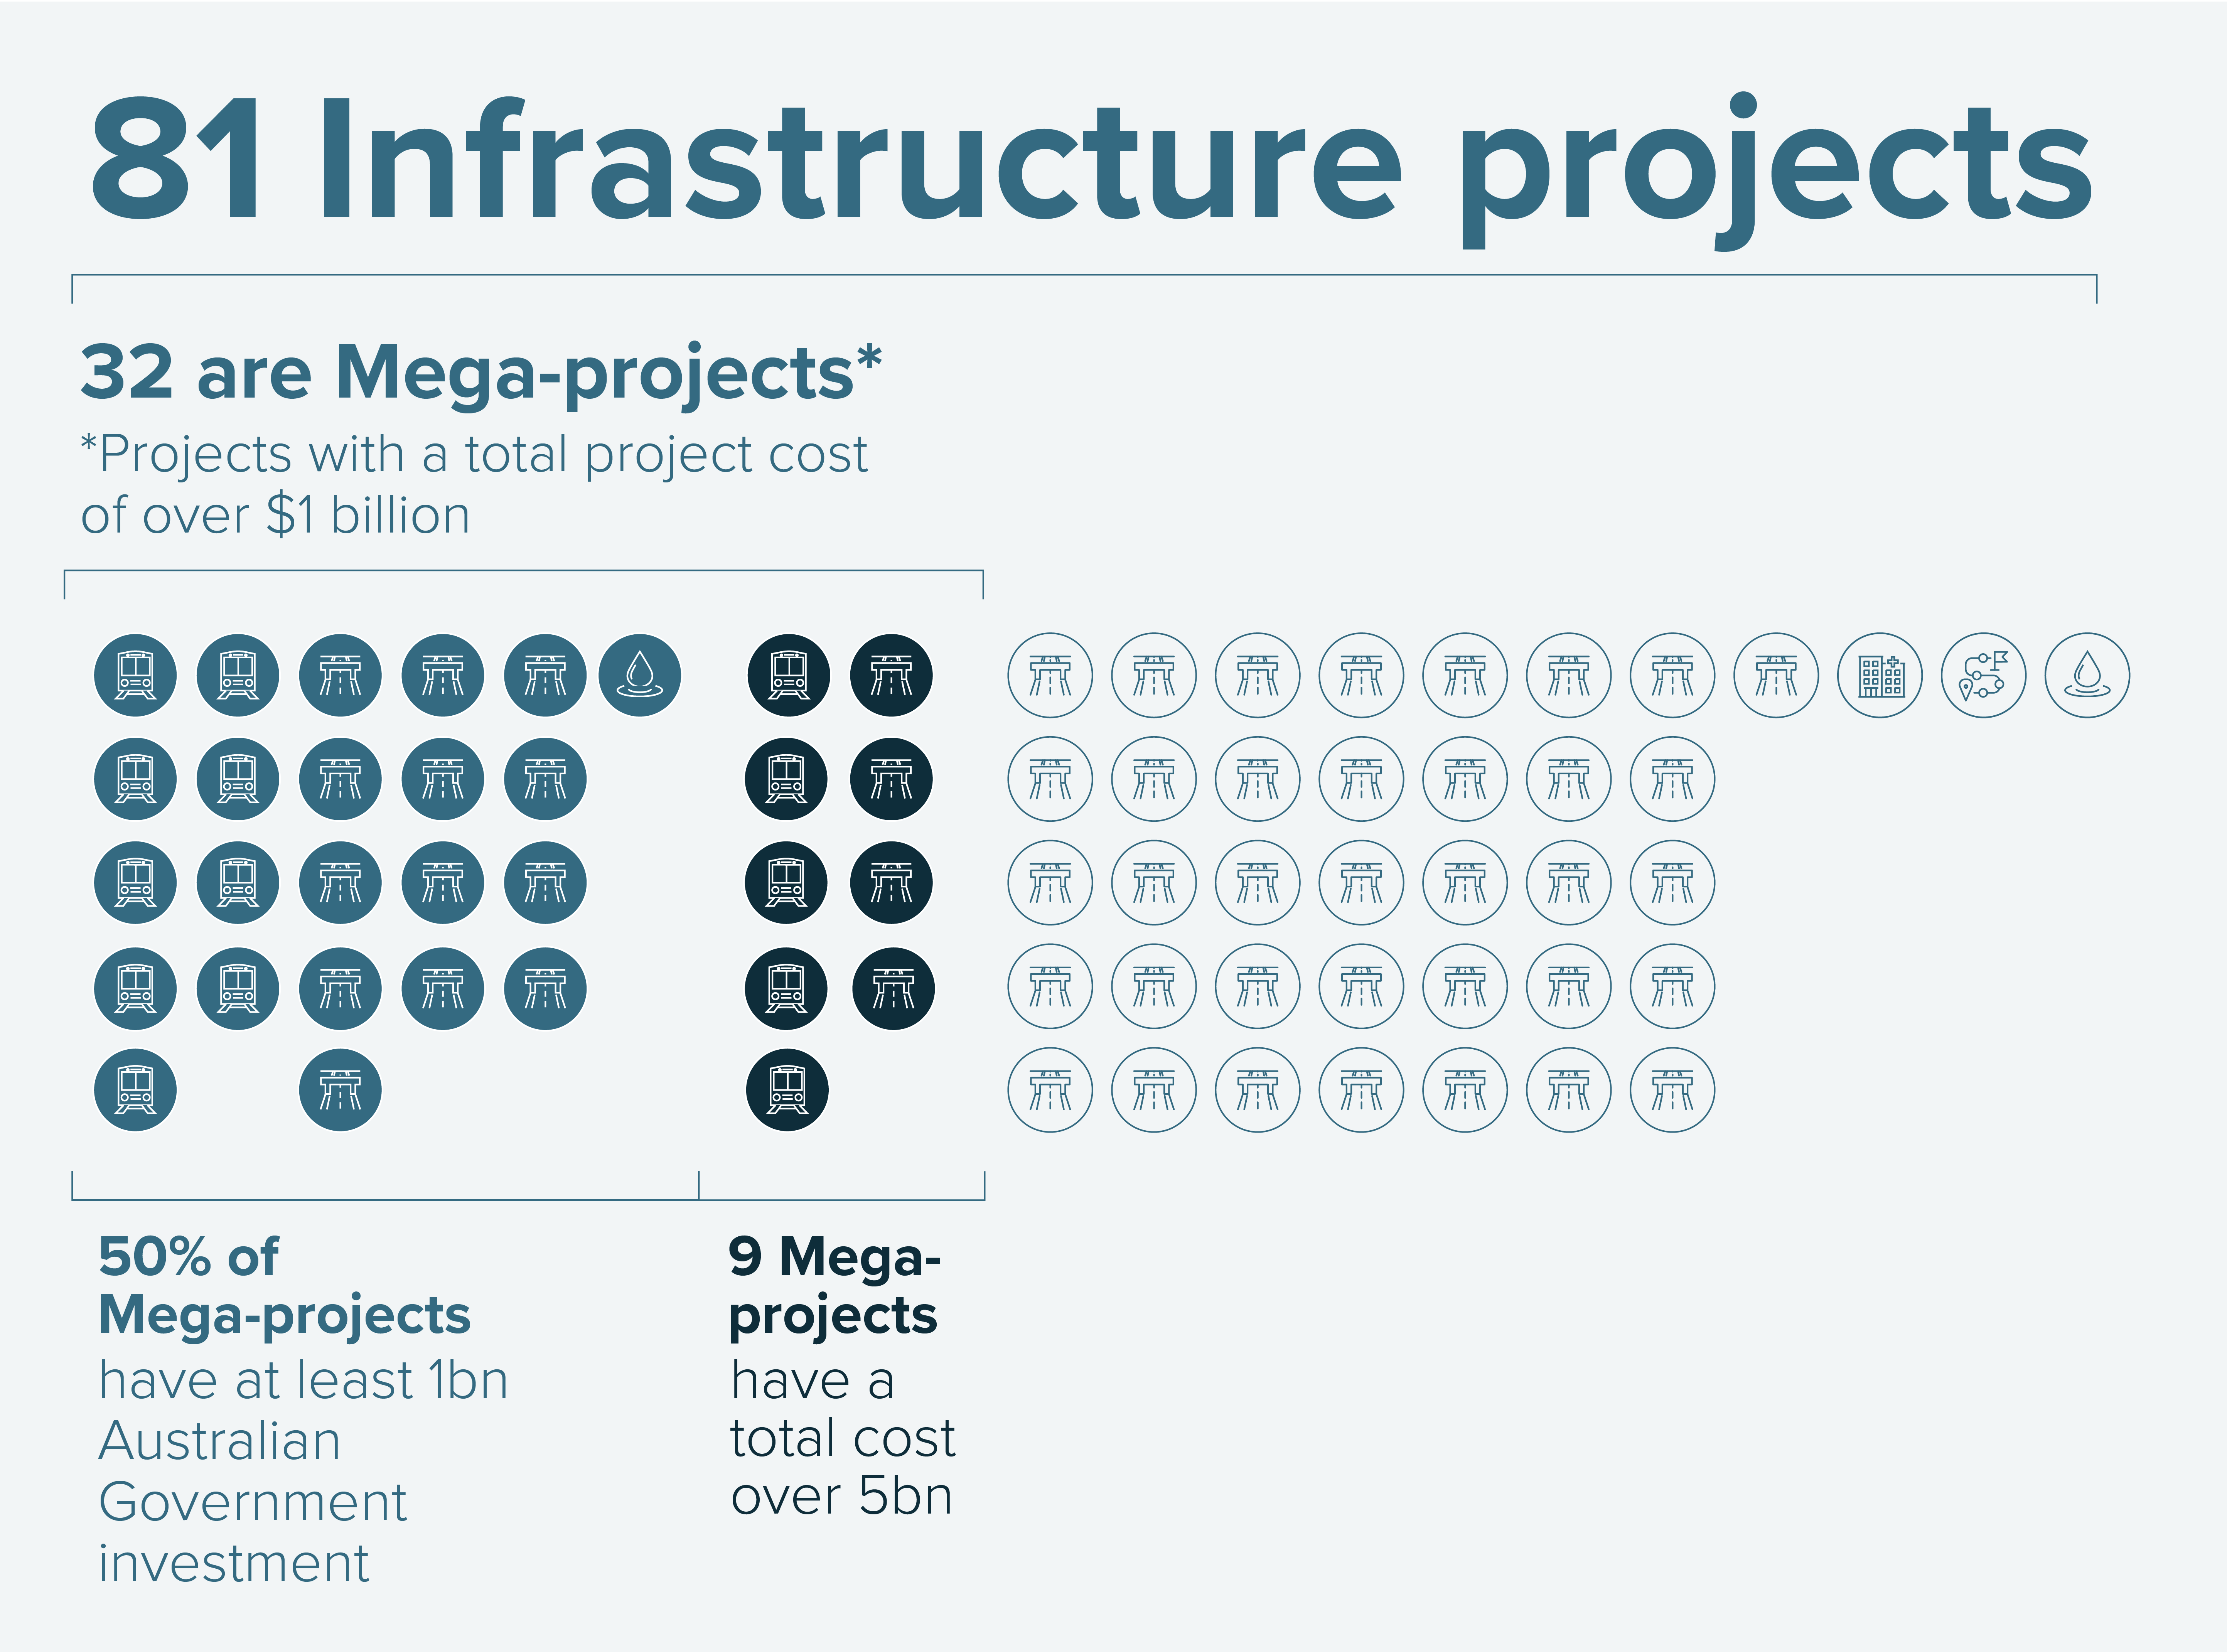
The in-scope projects include 32 megaprojects (investments with a total project cost of over $1 billion). Sixteen megaprojects have Australian Government investment of at least $1 billion. There are 9 projects that have a total cost over $5 billion, representing 64% of the in-scope projects by value, and 50% of the Australian Government’s investment. In comparison, the 49 projects with a total project cost of less than $1 billion represent 60% of projects by count, but only 16% by value and 24% of the Australian Government’s investment. Because of their size, megaprojects influence the performance of the Australian Government’s investments. As project size and complexity increase, project delivery becomes more complicated, and the relative impacts of realised risks and schedule delays on cost increase.
Figure 3: Megaproject count and size as proportion of all projects and Australian Government investment
Megaprojects and the infrastructure investment program
As noted in Infrastructure Australia’s 2024 Annual Budget Statement, megaprojects can increase the risk profile of the overall infrastructure investment program as they can be more at risk of cost and time overruns.
While in-scope projects did not have large cost or time variations this year, previous annual statements have demonstrated a correlation between size, time and cost risk.
With megaprojects influencing the size and profile of the Australian Government’s investment pipeline, Infrastructure Australia’s 2025 Market Capacity Report highlights the substantial opportunities for megaprojects to enhance innovation and productivity in the construction sector.
Despite a short-term lift in productivity (2% growth in 2023–24), long-term construction productivity remains stagnant and well below historical benchmarks. Modern methods of construction, including prefabrication, account for less than 5% of the market, and current procurement practices focused on lowest cost continue to discourage innovation and long-term value creation.
There is a clear opportunity to develop incentives and investment models that address the upfront costs of innovation, enabling broader national adoption of new technologies and methods. Targeted incentives for technology demonstration and scaling, along with harmonised standards and procurement processes, are practical ways the Australian Government can use its project sponsor role to drive innovation in megaprojects and reduce long-term risks in its investment pipeline.
Figure 4 shows that most of the Australian Government investments are in the planning or delivery phases: 34 projects (53% by investment value) are in planning and 33 projects (37% by investment value) are in delivery. Fourteen projects, 10% by value of the Australian Government’s investment, are completed. Figure 5 shows most megaprojects by value of Australian Government investment are in the planning phase.
Figure 4: Project phase by count (bars) and by Australian Government investment ($ billions) (line)
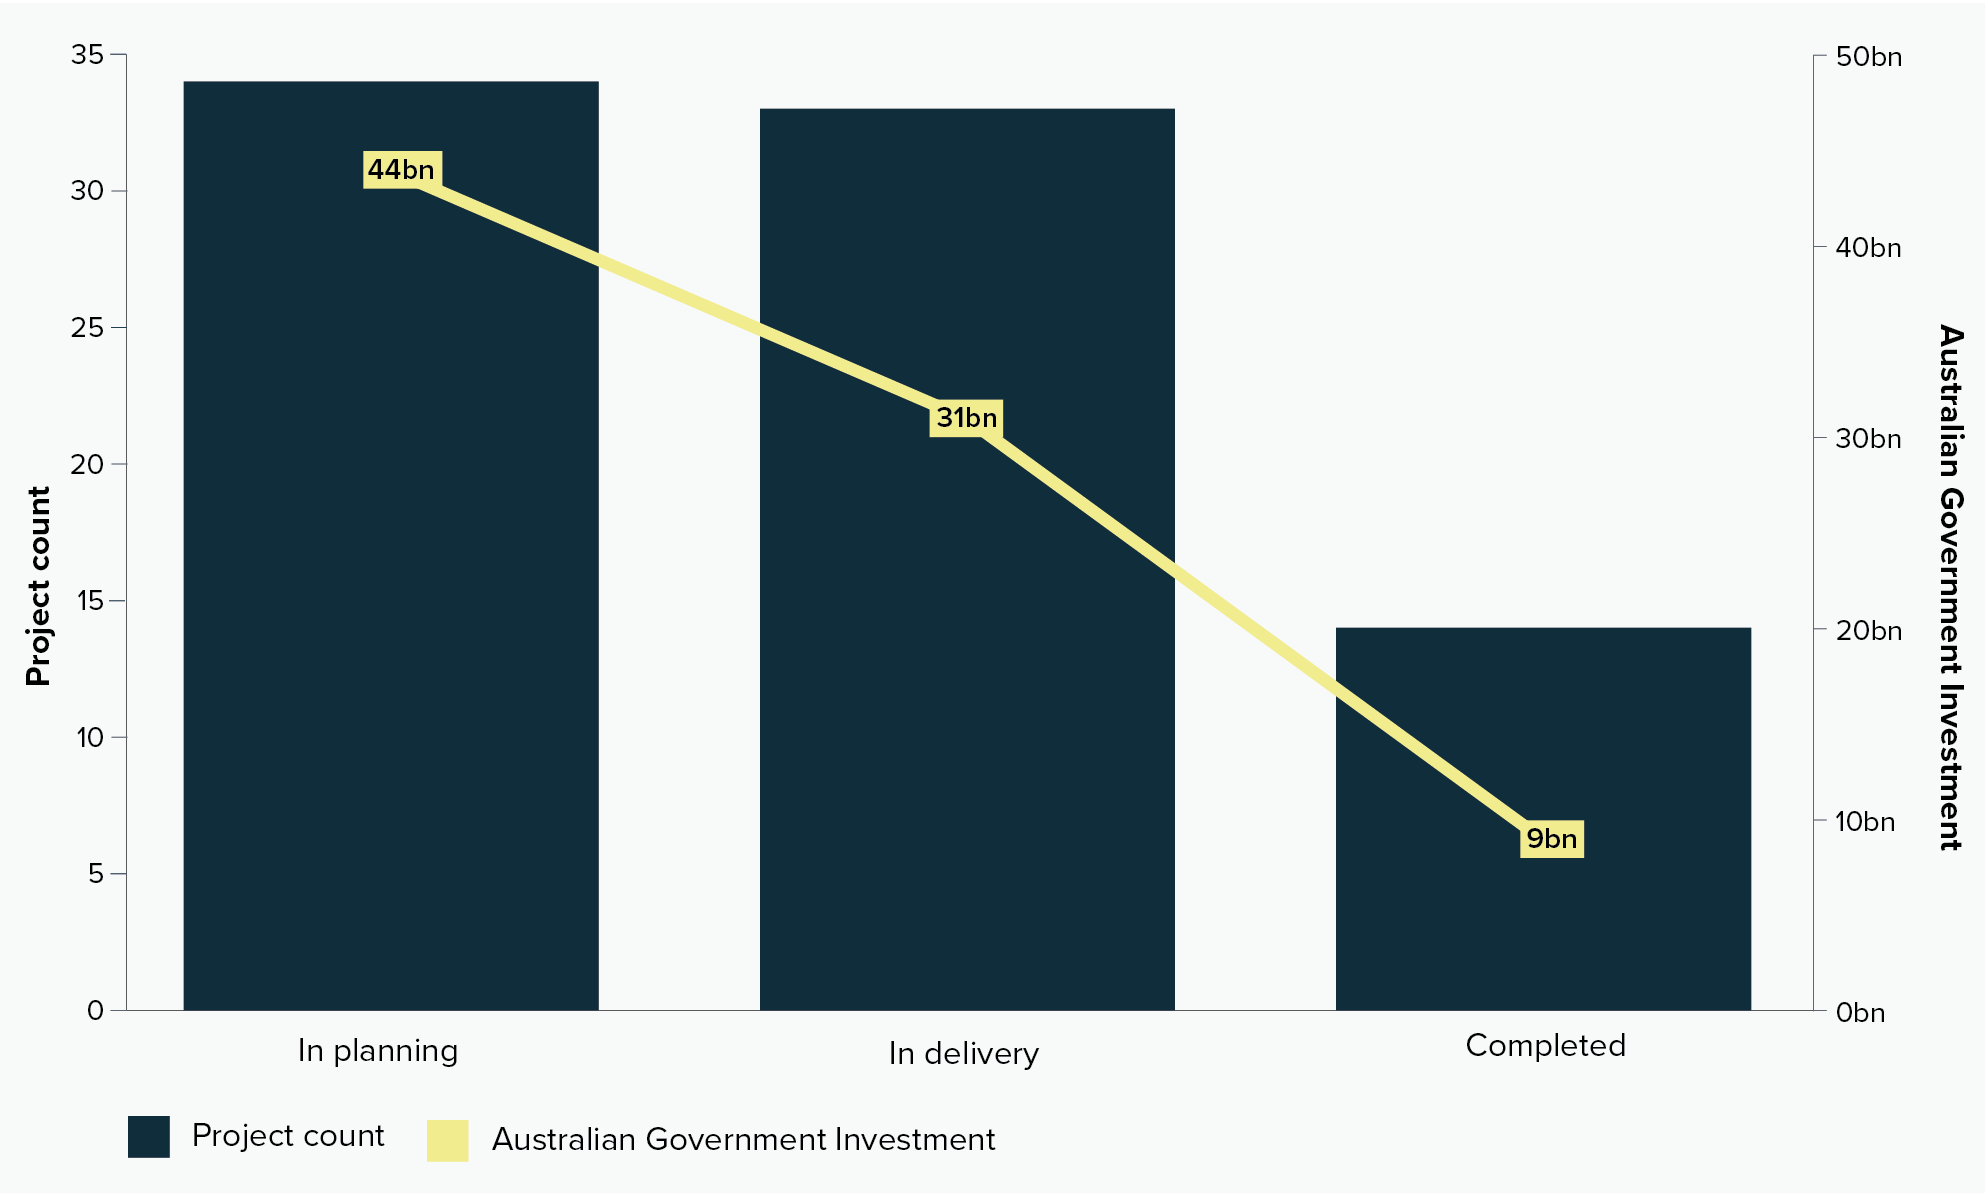
Figure 5: Australian Government investment by project phase and grouped by size of project ($ billions)8
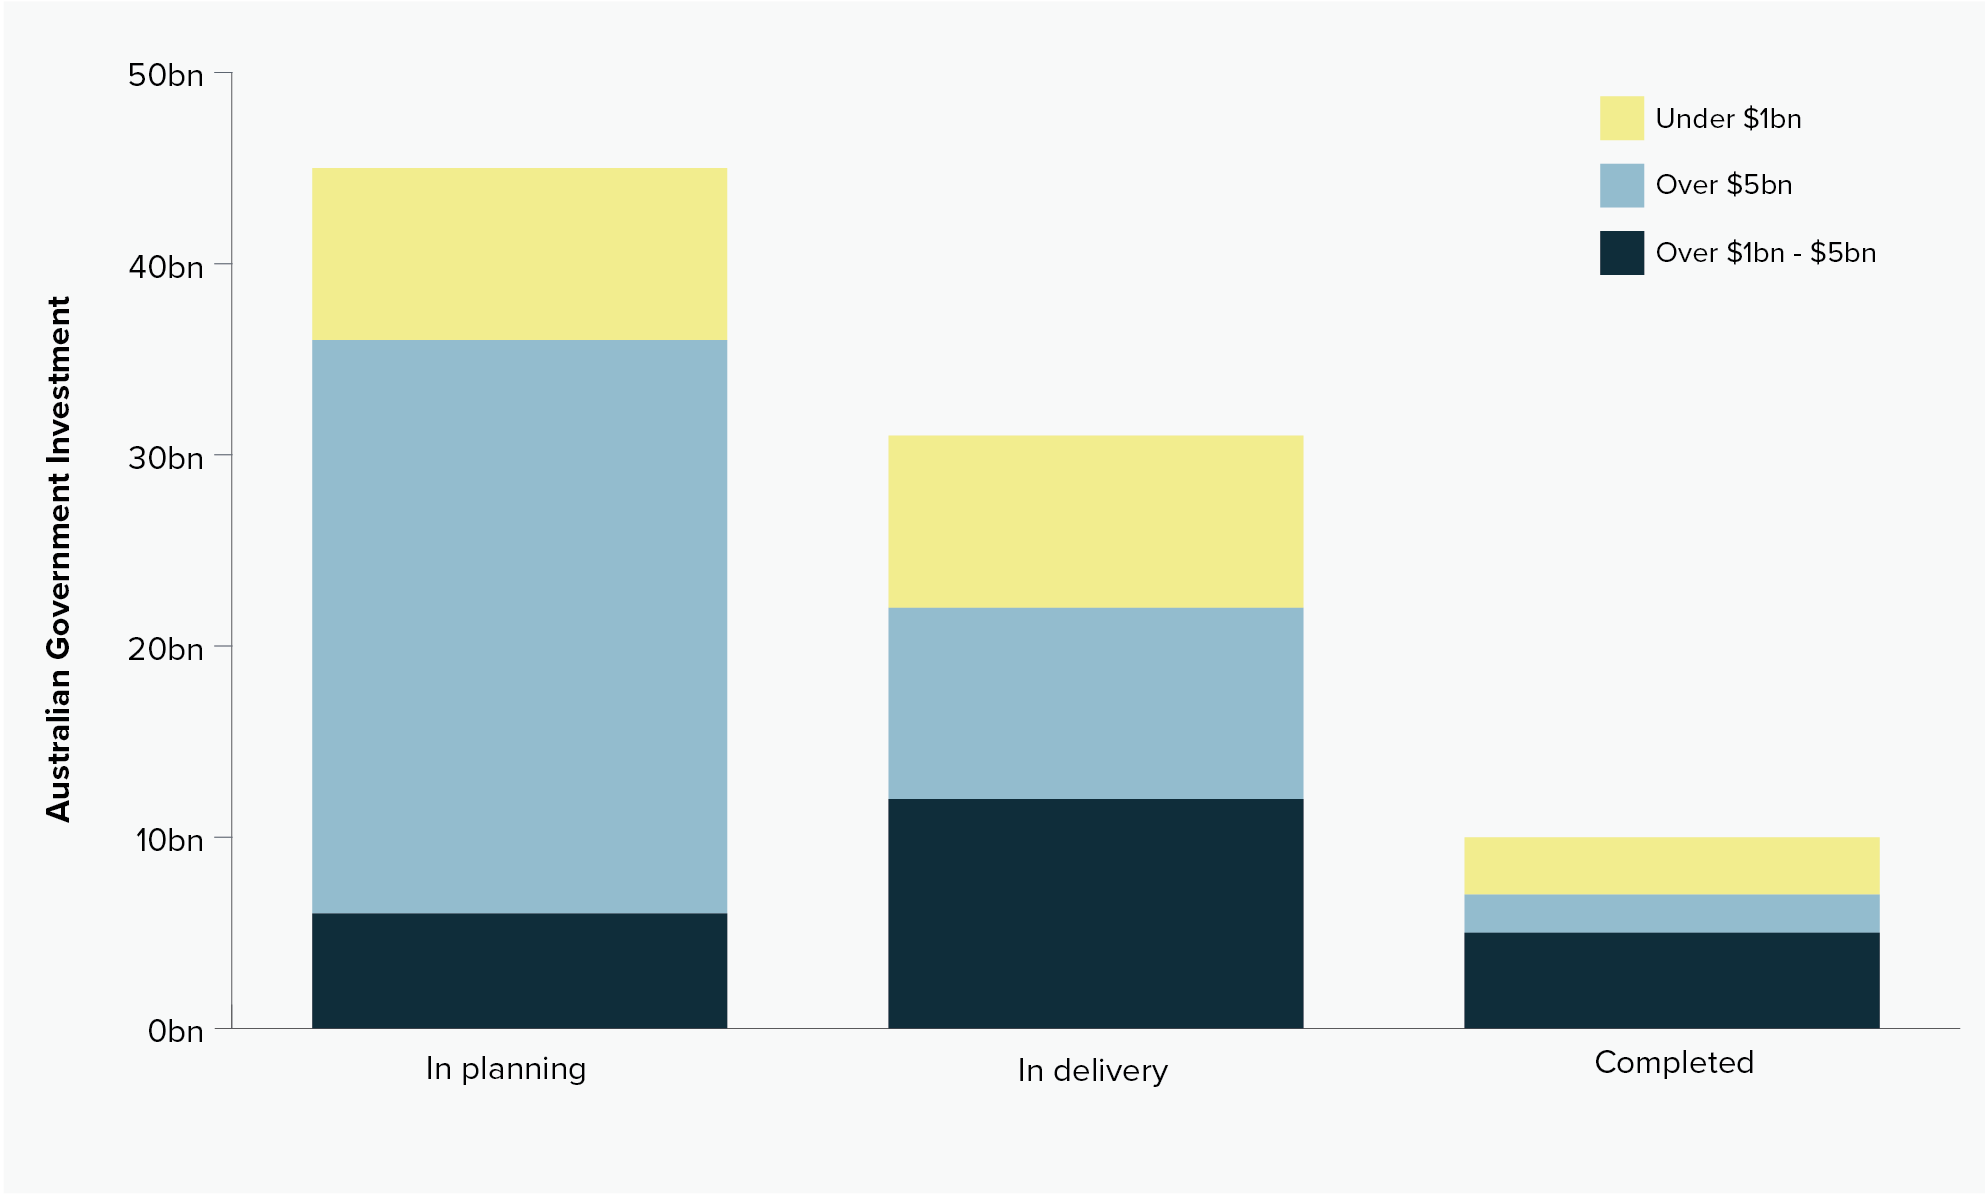
Figure 6 shows a forecasted profile of in-scope projects over their delivery schedules. Megaprojects represent 64% of the pipeline by value. Small shifts in timeline (and subsequently cost) for megaprojects can shift a significant proportion of the pipeline’s value, with meaningful impacts on market capacity and construction inflation.
Figure 6: Forecasted profile of in-scope projects over the delivery timeframe, megaprojects (over $1bn) represent majority of the pipeline ($ billions)9
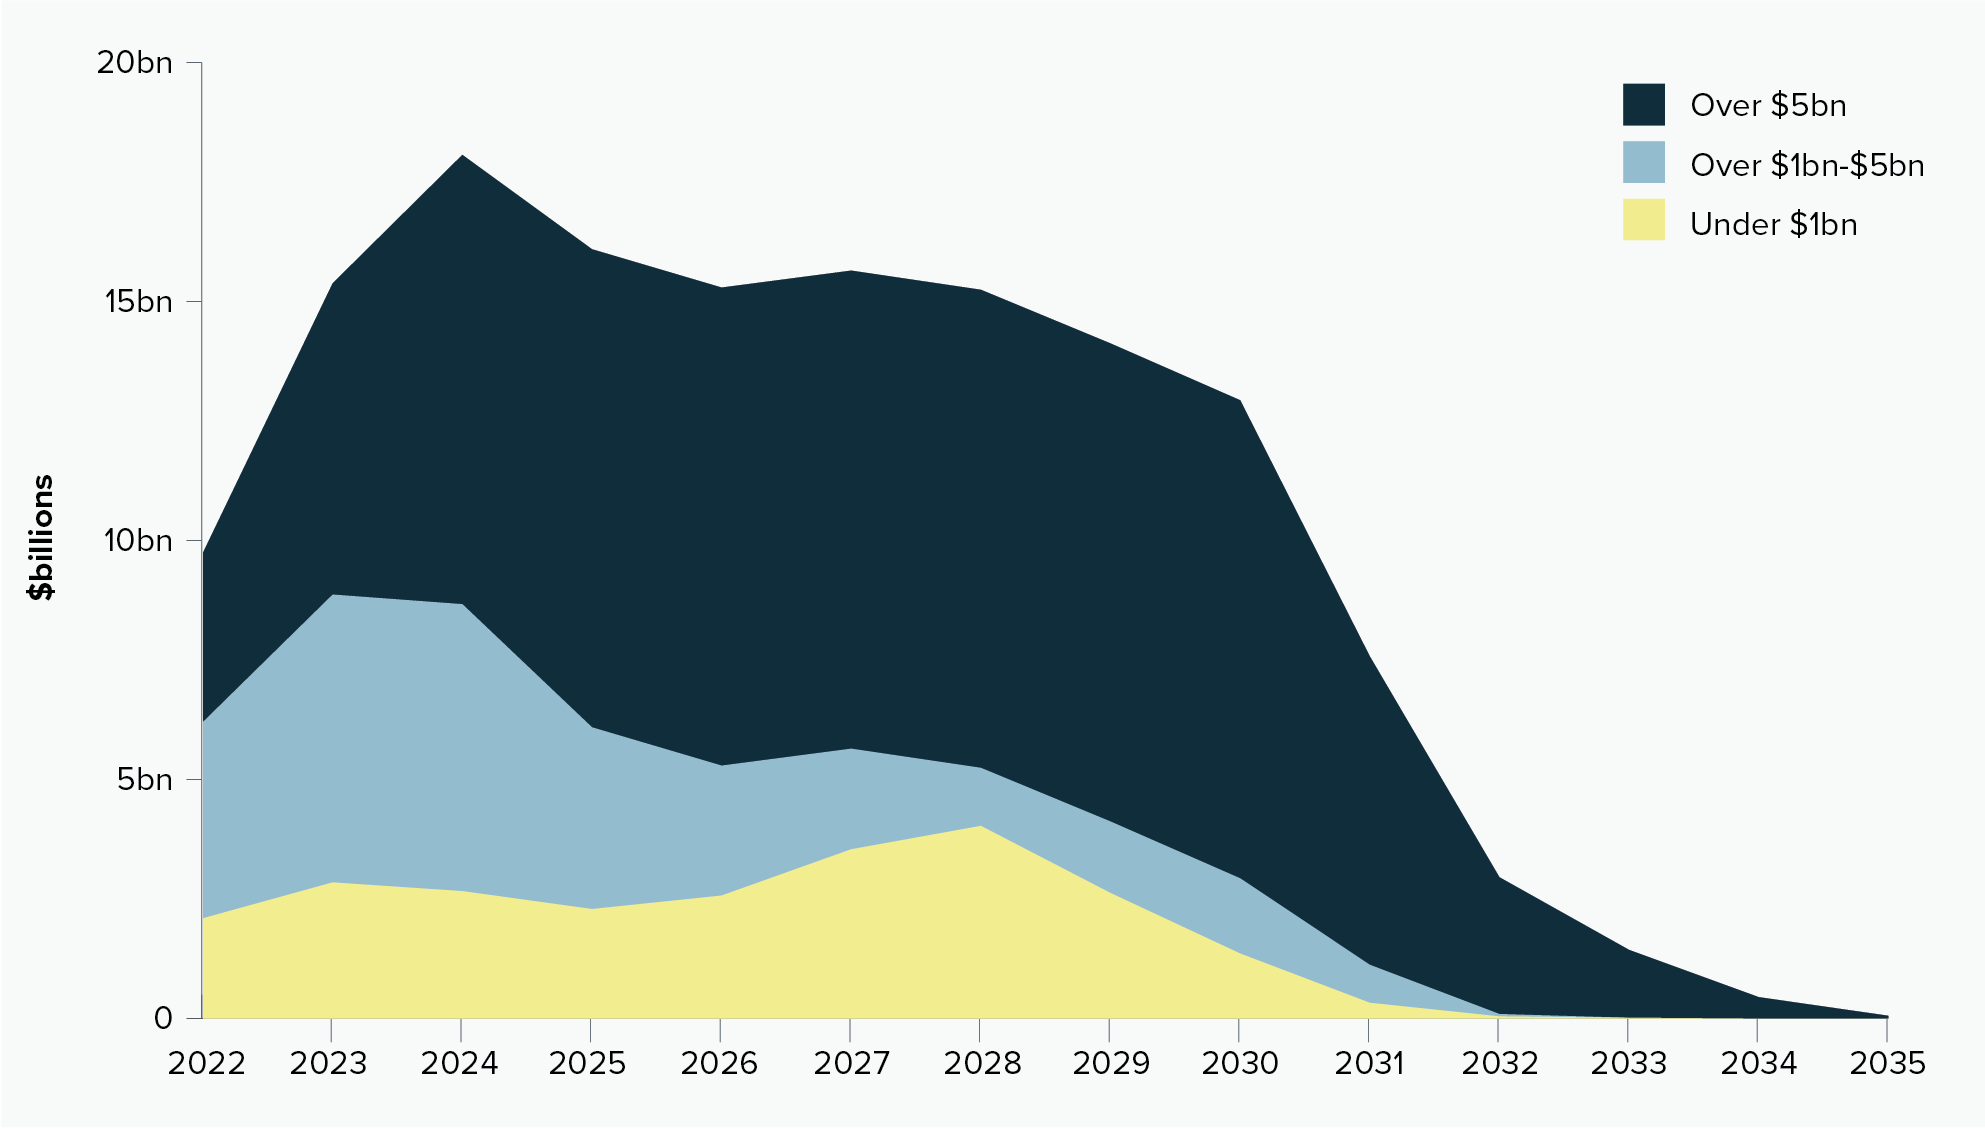
Maintaining a balanced program (sequencing projects, geographical diversity and asset type diversity), particularly for megaprojects, is important to provide a sustainable pipeline of investment for industry that is deliverable and provides a realistic funding profile for governments.
Changes between Budget 2024–25 and Budget 2025–26
Analysis of variation in cost and time between Budget 2024–25 and Budget 2025–26 is for 72 of the in-scope projects as it excludes the 9 projects that included new commitments in Budget 2025–26. These 9 projects appear in charts under ‘new/omitted project’.
Variations in delivery schedules
Project start dates have held or been brought forward in 58 (72%) projects since Budget 2024–25, and 14 projects are starting later (Figure 7 refers).
Forecast project completion date has been brought forward or remains unchanged for 48 projects (60%) with 6 projects forecasting earlier delivery completion (Figure 7 refers).
Expected project duration (time-to-completion) has increased for 17 projects with 13 projects expecting an increase in construction schedule of at least 25%, 2 projects expecting a schedule increase around 50% and 2 projects anticipating an increase in construction schedule of over 50% (Figure 8 refers).
Figure 7: Changes in start date and in forecast project completion date between Budget 2024–25 and Budget 2025–26, by project count
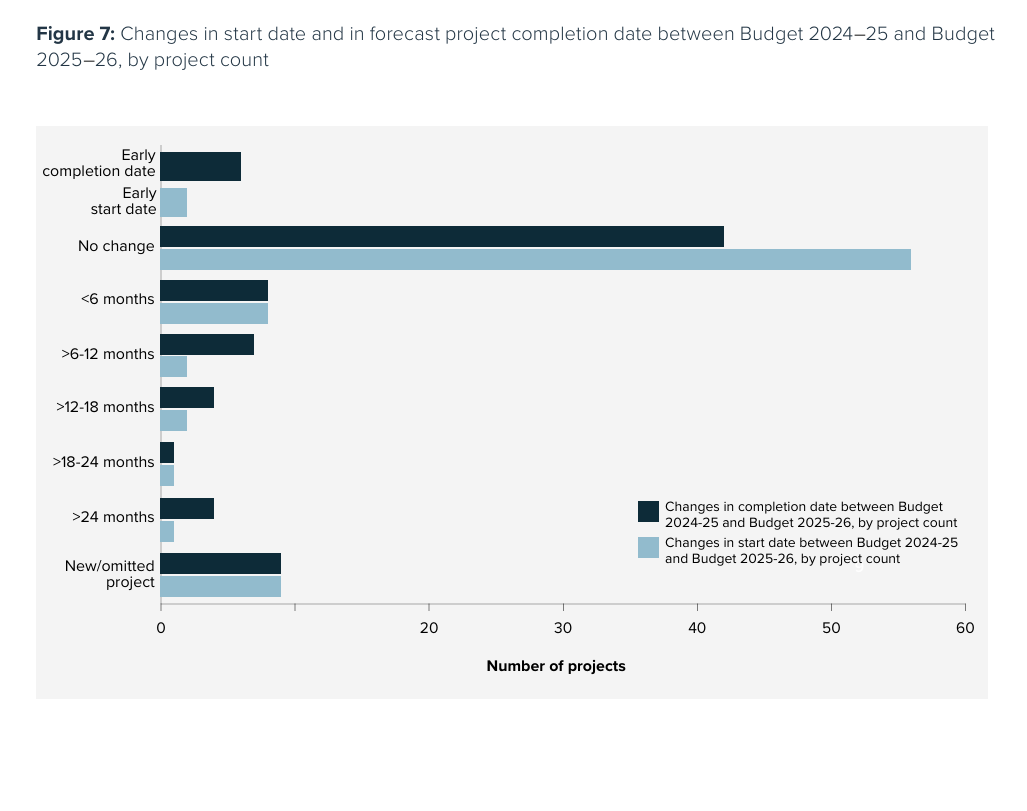
Figure 8: Percentage change in duration between Budget 2024–25 and Budget 2025–26, by project count (bars) and by value ($ billions) (line)
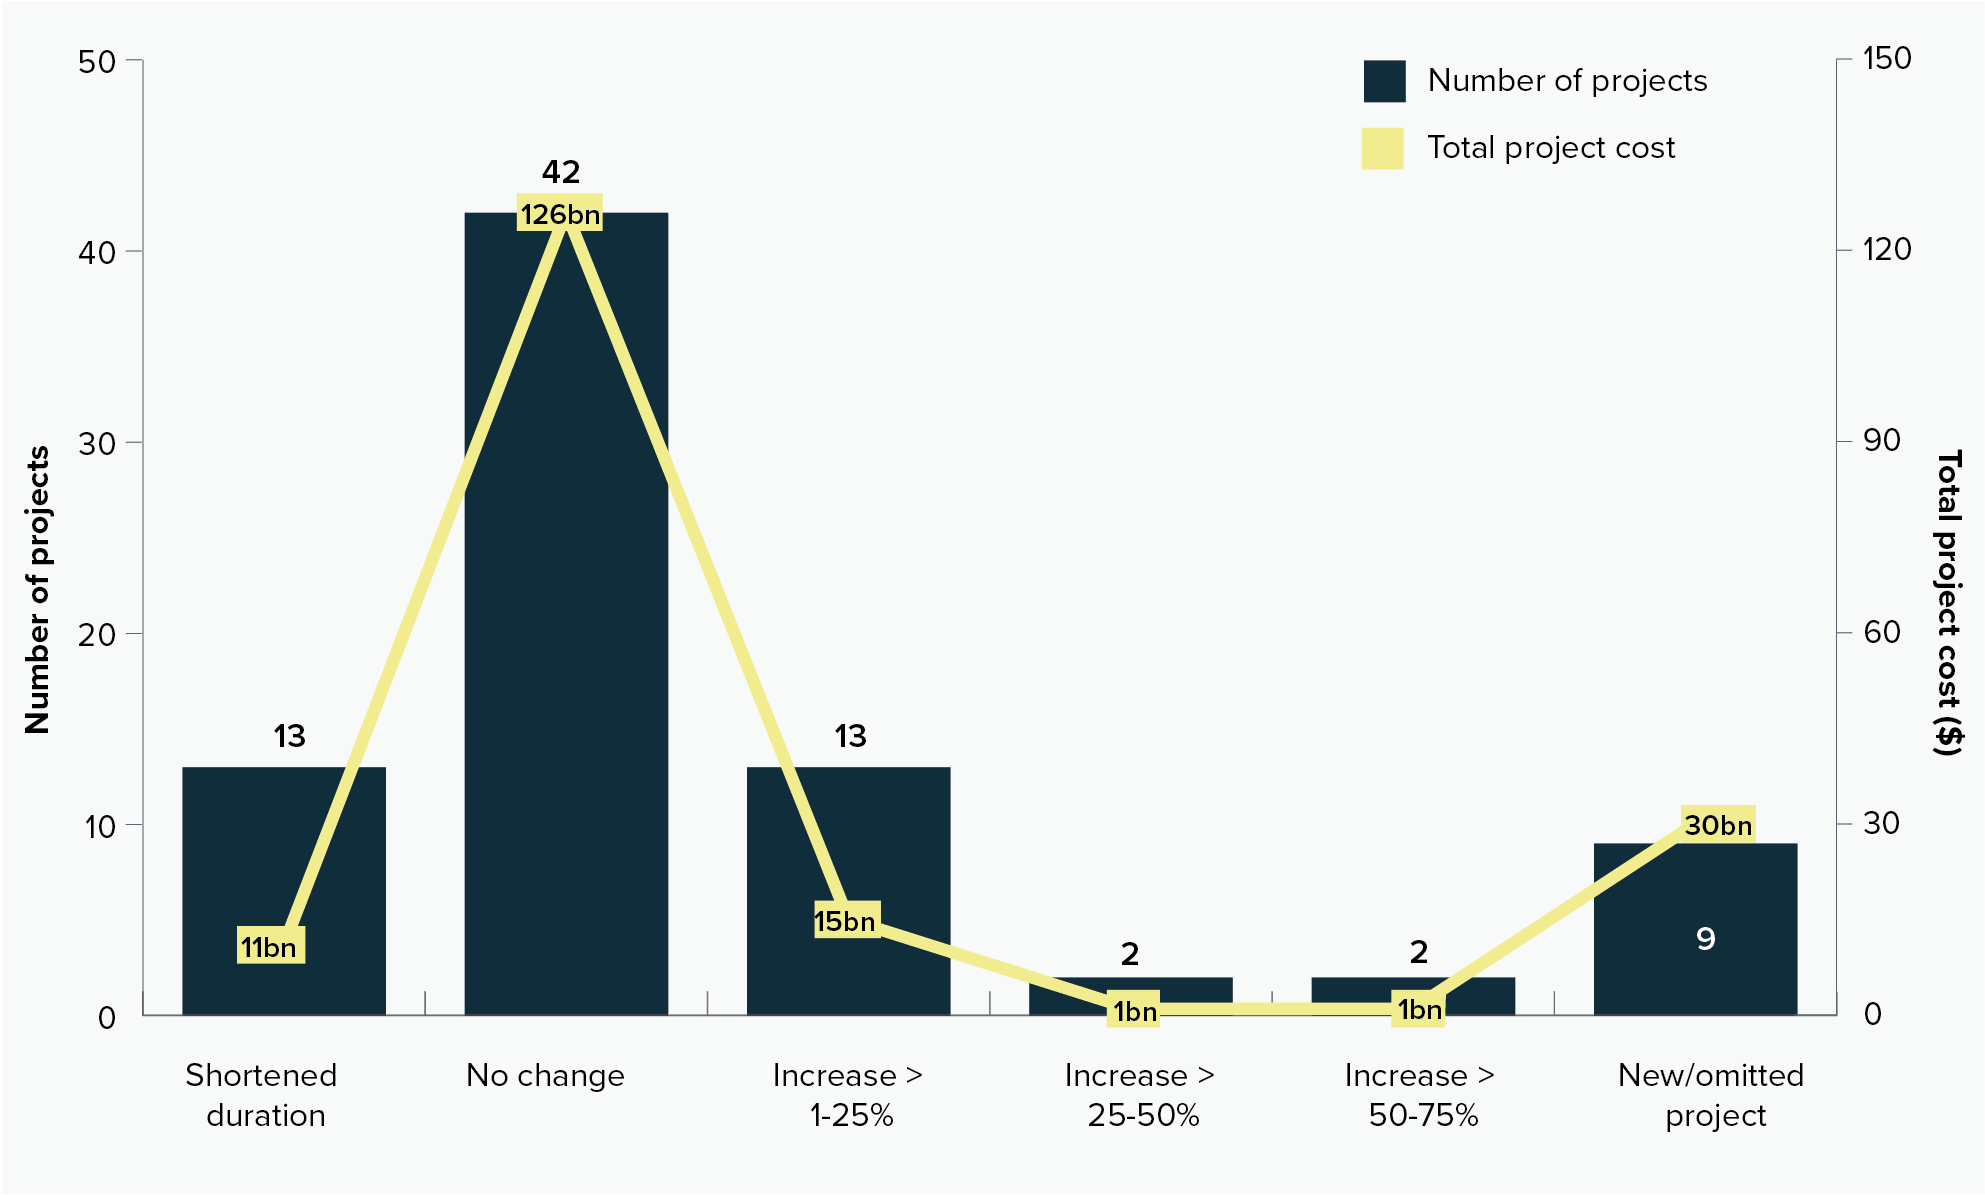
Figure 9 shows that projects with increased duration totalled $17 billion in total project value, or 9% of projects by value.
Increases in duration were more likely to occur in road projects (21% of road projects) as opposed to rail projects (17% of rail projects).
Project schedules were more stable in Budget 2025–26 (69% of projects by value with no change to time-to-completion), compared to Budget 2024–25 (48% of projects by value with no change to time-to-completion).
Variations in project cost and funding
Across the 81 in-scope projects, there have been much smaller changes in total project cost in Budget 2025–26 than in those reported for the same projects in Budget 2024–25.
Furthermore, most in-scope projects experienced smaller cost increases in Budget 2025–26 compared to Budget 2024–25. Only 6 projects saw any cost increases, 5 of these with cost increases less than 25% of project value in Budget 2025–26, versus 31 projects with cost increases in Budget 2024–25, 18 of these with cost increases more than 25%.
Correlating with improved project cost performance, Australian Government funding increases for in-scope projects in Budget 2025–26 were modest. Four projects received an increase in Australian Government funding, three of which involved increases of less than 25% (Figure 9 refers). This contrasts with in-scope projects in Budget 2024–25, where 29 projects saw Australian Government funding increases, including 11 with increases of more than 50%.
Figure 9: Percentage change in Australia Government funding between Budget 2024–25 and Budget 2025–26, by project count
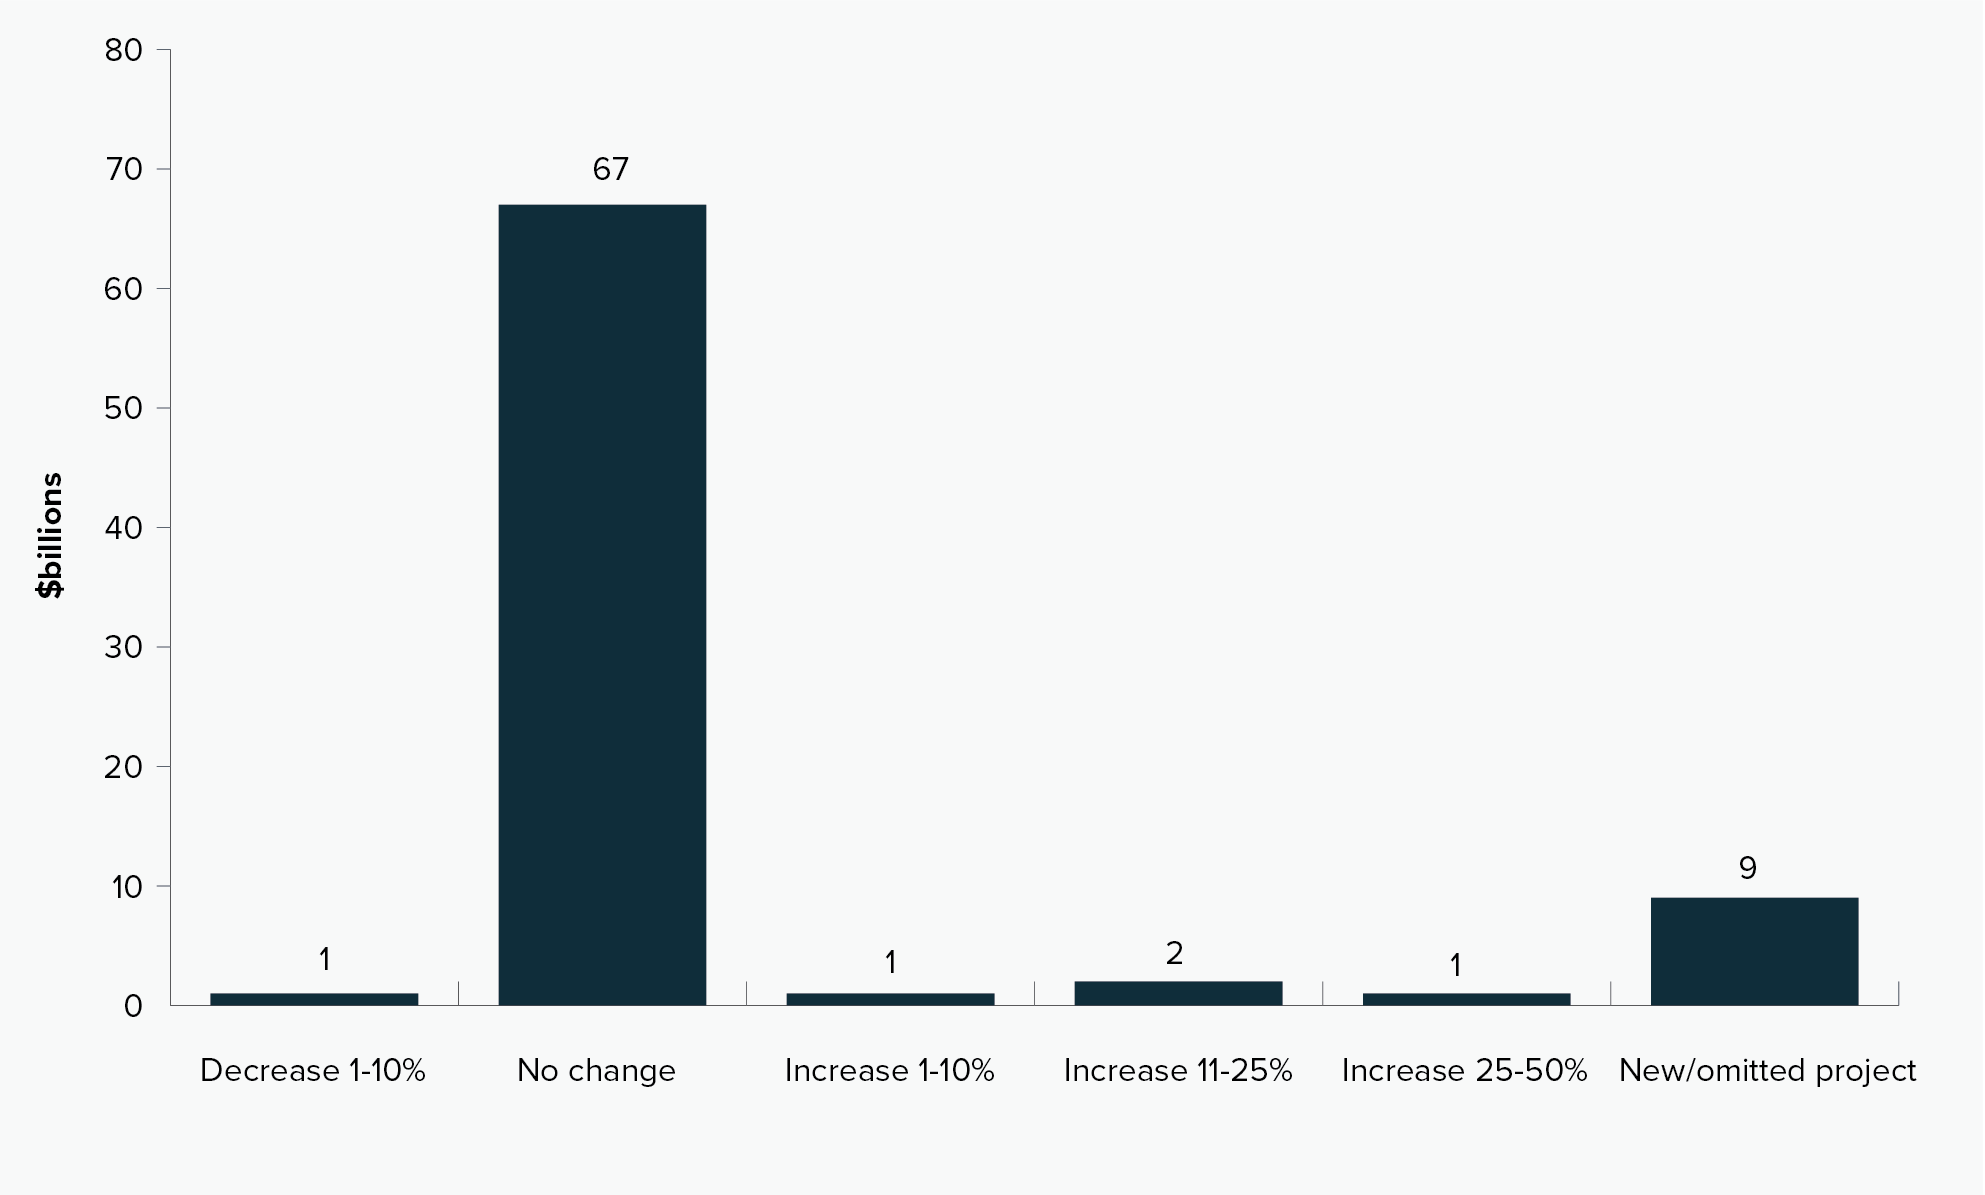
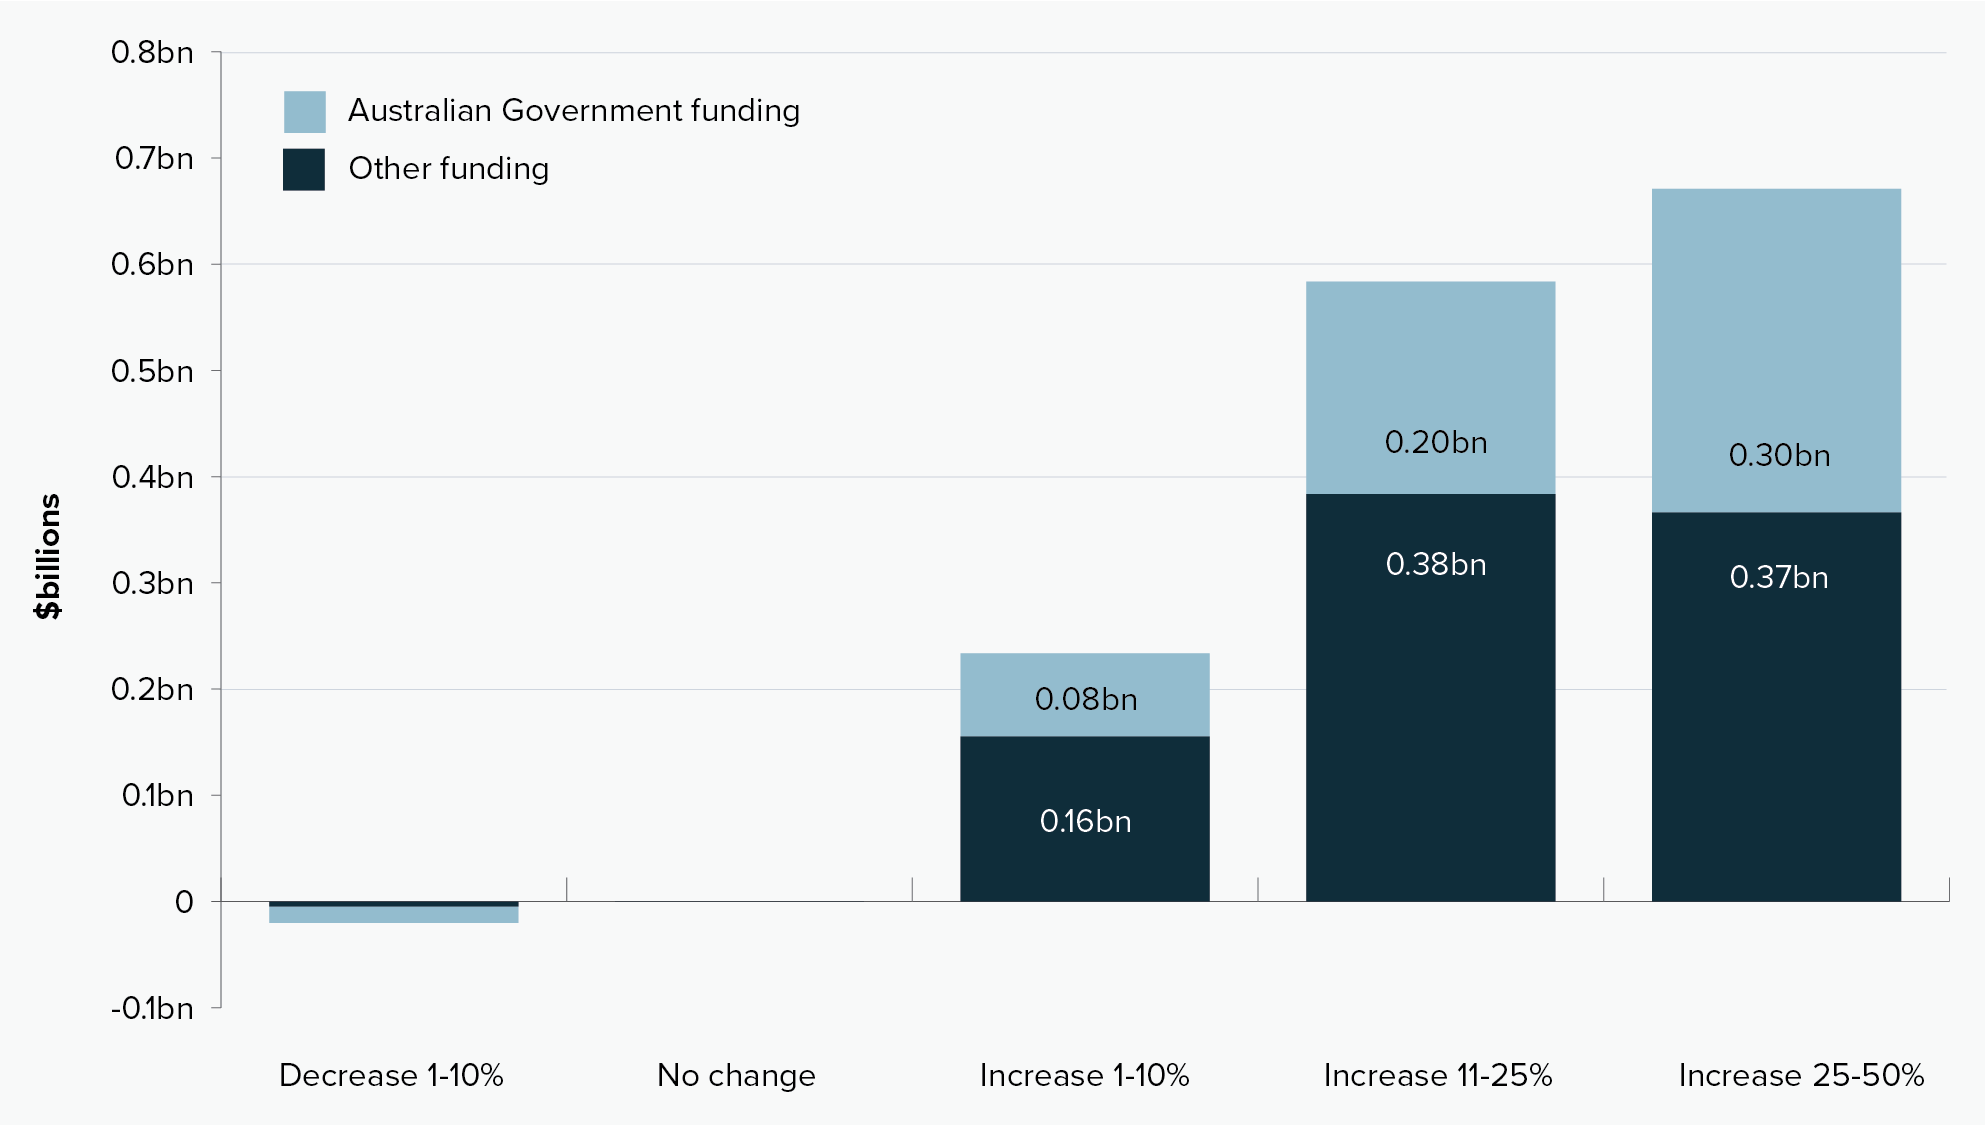
The Australian Government funded a lower number of cost increases across in-scope projects in Budget 2025–26, funding 38% of project cost increases (Figure 10 refers).10 All up, Australian Government funding increases on existing project investments in Budget 2025–26 increased by less than 1% on Budget 2024–25.11
Figure 10: Project cost changes between Budget 2024–25 and Budget 2025–26, grouped by funding source ($ billions)
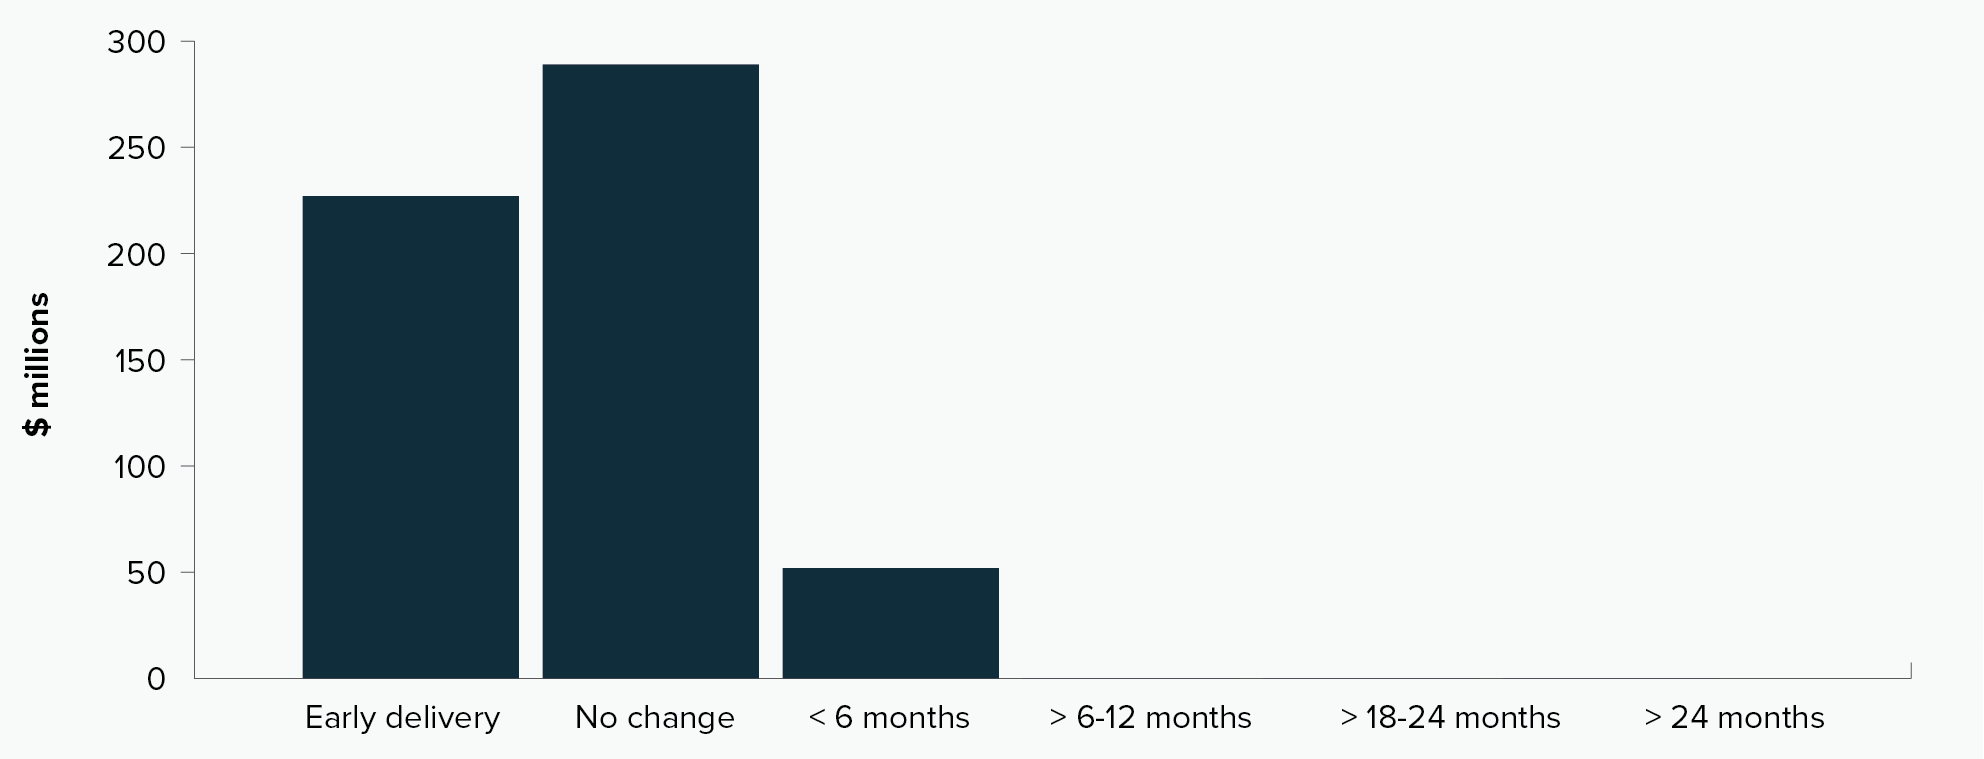
In Budget 2025–26, changes in Australian Government funding for in-scope projects did not align with longer time-to-completion. Over 90% of Australian Government funding increases were allocated to projects that are expected to be delivered early or with no change to their schedule, with only a small proportion directed to delayed projects (Figure 11 refers). This could indicate that additional funding was primarily focussed on stabilising or accelerating existing project delivery, rather than addressing schedule slippage as 98% of cost increases occurred in projects in delivery.
Figure 11: Change in Australian Government funding due to change in project duration ($ millions)
_____
- There are significant Australian Government investments in infrastructure outside of the FFR system, including equity investments and loans through Government Business Enterprises such as the NBN Co, Snowy Hydro and Western Sydney Airport Co, and through Special Investment Vehicles such as the Northern Australian Infrastructure Facility, the Clean Energy Finance Corporation and Housing Australia.
- Aligned with reporting by the Department of Infrastructure, Transport, Regional Development, Communications, Sport and the Arts.
- Project data was provided by the Department of Infrastructure, Transport, Regional Development, Communications, Sport and the Arts for transport and social infrastructure projects and by the Department of Climate Change, Energy, the Environment and Water for water infrastructure projects.
- This includes Melbourne Airport Rail which had significant new scope added at Budget 2025–26 with Sunshine Station redevelopment added to the project. It is omitted from analysis of time and cost changes to avoid skewing results.
- Megaprojects have a total project cost above $1 billion.
- The main macroeconomic drivers of infrastructure project costs are inflation, interest rates, commodity prices, and labour market dynamics, which collectively influence the cost of materials, financing, and labour. These factors are partly exogenous to government policy. Project-specific factors are scope, project management and governance, resource management, planning and forecasts, engineering and design, contractual and stakeholder issues, and geotechnical and site conditions.
- May not sum due to rounding.
- Infrastructure Australia has calculated each project’s Total Project Cost distributed across its construction years using a standard S-curve formula.
- ~$568 million in Australian Government funding increase, over ~$1.5 billion of total project cost increases.
- Australian Government funding increases less decreases in 2025–26 equals $568 million, over Australian Government total investment in 2024–25 which equalled $70 billion. See Annual Performance Statement 2025
