2025 Infrastructure Market Capacity Report
13 November 2025
Chief Commissioner’s foreword
Each year, Infrastructure Australia evaluates the demand to build across the nation, and calculates the resources required to deliver on that demand. Now in its fifth year, this research offers an evidence base to strengthen national coordination, ensuring that infrastructure investment is both achievable and sustainable.
The research helps governments better sequence their project pipelines by providing a clearer view of the workforce and materials needed. It offers a national perspective, enabling jurisdictions to focus beyond borders on construction market issues across the country.
We have ambitious goals ahead of us — lifting national productivity, transitioning to a clean energy future, and substantially boosting housing supply to meet the needs of Australians today and into the future. Infrastructure is a critical enabler of economic growth and social outcomes. A cross-jurisdictional, cross-sector view of the pipeline helps us make better decisions on what to build, when to build it, and how to meet the needs of communities.
The research has drawn international attention, with jurisdictions like Canada pursuing similar work to support their ambitious housing programs whilst facing workforce shortages and productivity challenges.
The strength of this research lies in the collaborative relationships Infrastructure Australia has formed across industry and government and with our international counterparts. We acknowledge and thank all participants for the part they played in developing this year’s report, through data sharing and close collaboration.
Our Infrastructure Market Capacity research has grown into a trusted and reliable source of information that captures the $1.14 trillion of construction activity happening right across the country. The report also continues to detail and explore the plant, labour, equipment and materials needed to deliver on the nation’s five-year Major Public Infrastructure Pipeline —which has grown 14% over the last year and now stands at $242 billion.
The successful planning and delivery of infrastructure is critical in supporting our nation’s growing cities and regions, particularly as we navigate the growth in investment across renewable energy and social infrastructure projects, while continuing to deliver record levels of investment in major transport projects.
As governments navigate these decisions, Infrastructure Australia is committed to supporting the Australian Government with independent advice to drive a thriving, efficient and productive construction sector for the economic and social prosperity of all Australians.
Tim Reardon
Executive summary
Australia’s Major Public Infrastructure Pipeline is $242 billion across the five years from financial years 2024–25 to 2028–29 (‘five-year outlook’), up 14% compared with the projection of 12 months earlier for the corresponding outlook period 2023–24 to 2027–28. This outcome reflects governments’ ambitions to boost housing stock and transition our energy sources towards a net zero future, while holding steady the record levels of investment in productivity-enhancing transport infrastructure.
Demand for major public infrastructure projects has risen for the first time since 2022 as governments grow investments in buildings and utilities while transport investment continues to dominate pipelines
Infrastructure Australia has updated its Market Capacity database with relevant Major Public Infrastructure Pipeline information provided by state and territory governments. A comparative analysis of the national Major Public Infrastructure Pipeline outlook versus the previous outlook period from 12 months earlier reveals:
- Demand has increased by 14% on the previous year’s outlook.
- There is a significant increase in either public-funded housing investments or energy transmission projects across all of Australia’s states and territories.
- Delivery challenges are slowing the rate of the energy transition, with delays to the start of construction for many private infrastructure energy projects.
Key changes in the Major Public Infrastructure Pipeline across the past 12 months include:
- Transport infrastructure investment is projected at $129 billion and remains the largest expenditure category, accounting for 53% of the Major Public Infrastructure Pipeline. This is a $3 billion (2%) increase on the previous year’s outlook and quite steady.
- Projected demand expected in the final year in the outlook period is much higher than observed in the first four editions of the Infrastructure Market Capacity reports. It indicates that government investment may be becoming more certain across a longer-term time horizon.
- Buildings infrastructure investment is projected at $77 billion, which accounts for 32% of the Major Public Infrastructure Pipeline. This is up $6 billion on the previous year’s outlook (up $14 billion compared with the outlook from two years earlier). Buildings infrastructure is driven by social and affordable housing ($28 billion) and health projects ($22 billion).
- Utilities infrastructure investment is projected at $36 billion, which now accounts for 15% of the Major Public Infrastructure Pipeline and is up $20 billion on the previous year’s outlook. This increase is predominantly explained by additional transmission line projects.
Materials cost escalations have stabilised, but more attention is needed to ensure sovereign capability in steel and increase uptake of low emissions materials
Cost growth of key materials such as cement and timber has eased to around inflation levels indicating stabilisation of price volatility seen during the Covid-19 years. Steel prices however continue to fall, a downward trend since 2022.
Domestic steel fabrication capability presents a potential sovereign supply chain risk to a key infrastructure input. The industry reports being under severe pressure from cheaper imports (offered at up to 50% cheaper than what local producers can viably offer) and with import volumes growing by 50%.
The Australian Government has committed to supporting green metals fabrication under the Future Made in Australia agenda (Green Metals Package), and to supporting the administration and sale of the Whyalla Steelworks, which produces 75% of Australia’s structural steel and is the only domestic source of long steel products.
More could be done now to ensure the sustainability of fabricators further down the steel supply chain.
At the same time, lower emissions and recycled materials remain a largely untapped pathway to reduce emissions in infrastructure delivery. A range of state and territory policies encourage the use of low-emission and recycled materials in infrastructure construction. This creates a strategic opportunity for governments to lead a nationally-coordinated approach that strengthens market capacity and accelerates industry growth.
Stronger procurement levers, harmonised standards, and pathways beyond research and pilots are needed to scale adoption and fully realise the decarbonisation potential on an industrial scale.
Peak workforce shortage could reach 300,000 as the sector faces both supply and skilling challenges
Labour remains the most critical delivery risk. After a brief easing in 2024, shortages are projected to surge and could reach 300,000 workers by 2027. Regional areas will be hardest hit, with shortages forecast to quadruple between 2025 and 2027.
The sector faces a dual challenge: filling critical roles in sustained short supply and upskilling the workforce for the digital and net zero transition. Industry soundings from in-depth interviews on the energy transition suggest that companies are adopting a cautious, ‘wait and see’ approach to workforce and skills investment, rather than committing to long-term training or efforts to boost baseline workforce supply. There is currently ambiguity around exactly how and the extent to which workers can transition across adjacent sectors to meet demand once materialised.
Various pilots and initiatives by governments, industry and the training and education sectors are underway to address construction workforce challenges. National alignment and coordination across these initiatives, and boosting industry confidence in the energy pipeline, will help firms invest more in building future workforce and capabilities.
Initial steps have been made to unpack the productivity problem, with further scope to examine the subcontracting ecosystem and incentives to embed innovation
Productivity in Australia’s construction sector remains stubbornly low despite a short-term rebound, with multifactor productivity rising 2.0% in 2023-2024 after a decline the year before. The long-term trend is flat and well below mid-1990s levels.
Structural issues persist: a heavy reliance on subcontracting (41% of infrastructure construction) introduces interface risks and erodes Tier 1 self-performance, while workforce diversity remains poor — women make up just 13% of the workforce and 4% of trades.
State, territory and federal governments are supporting the uptake of modern methods of construction, however prefabricated construction currently makes up less than 5% of the total market. Outside of dedicated modern methods of construction projects, prevailing procurement models focused on lowest cost discourage innovation that delivers long-term value. Regulatory and financing barriers may also impede modern methods of construction uptake, and the Australian Government is working to address these.
Two major national initiatives could drive change: the National Construction Strategy, due by end-2025, and the National Construction Industry Forum’s Blueprint for the Future, endorsed in September 2025. While these mark promising first steps to addressing systemic productivity challenges for construction, their real impact will depend on how they are implemented and the concrete actions that follow.
Progress made by governments over the last 12 months
Infrastructure is a necessary and key enabler to achieving key government priorities such as boosting national productivity, net zero transition and boosting housing stock. Over the past 12 months, governments have progressed significant initiatives and reform agendas which will help to strengthen the market’s capacity to deliver.
Key progress by the Australian Government across the four themes presented in previous iterations of the Infrastructure Market Capacity report:
Active pipeline management to mitigate delivery constraints — implementation of the new Federation Funding Agreement Schedule (FFAS) on Land Transport Infrastructure (2024-2029), which includes for the first time the collection of bilaterial performance reports from states and territories on progress against agreed policy priorities to enable outcomes that would boost supply (such as lift recycled materials uptake, skills training, workforce diversity). By tracking performance and setting benchmarks against these priorities, governments could prioritise projects that deliver the greatest strategic value and boost market capacity and capacity to deliver.
Separately, the Australian Government has committed to fast-track environmental approvals on clean energy projects and regional planning under Environment Protection and Biodiversity Conservation Act 1999 (EPBC Act) reforms and also commenced a new pilot of the Investor Front Door program (September 2025) to support delivery of transformational energy projects.
- Boosting materials supply — measures focused on supporting industry transition and boosting Australia’s competitiveness in the net zero economy, including major investments under the Future Made in Australia plan to expand domestic manufacturing, accelerate the adoption of low-emissions materials and maintain domestic steel manufacturing capacity at Whyalla Steelworks.
- Boosting labour supply — a raft of initiatives including expanding TAFE and apprentice incentives, national licensing reform of electrical trades and fast-tracking construction related assessments through the Skills Migration Framework.
Lifting construction productivity — the Australian Government is driving transformative reforms aimed at lifting national productivity across all sectors of the economy.
The construction industry will benefit from initiatives to cut regulatory red tape and promote national harmonisation of licensing, standards and certifications delivered as part of the National Competition Policy reforms and supported by the $900 million National Productivity Fund. Additionally, the Australian Government is investing $4.7 million to develop a voluntary national certification scheme to support offsite construction, streamline approvals and ensure high quality standards are met, and $49.3 million supporting state and territory governments to expand prefabricated and modular home construction opportunities.
A cornerstone initiative led by the Australian Government and targeted at the construction industry specifically — the National Construction Industry Forum’s Blueprint for the Future, developed by representatives across employers, workers and government — will drive nationally-coordinated actions to lift productivity across the sector. The blueprint outlines nine priority recommendations for reform, including cultural change, risk allocation and skills development, to tackle systemic inefficiencies and boost productivity across housing and infrastructure projects.
Recommended future opportunities for the next 12 months
Building on the progress made by governments over the last 12 months and updated insights on the Major Public Infrastructure Pipeline, this report identifies opportunities for Australia’s governments to further strengthen market delivery capacity through pipeline management, boosting supply and lifting construction productivity. Table 1 sets this out in detail.
Table 1: Update on progress made over the last 12 months and future opportunities
| 1. Active pipeline management | |
|---|---|
| Progress over last 12 months | Current state – key findings |
National Renewable Energy Priority List established (March 2025), with listed projects receiving coordinated support from the Australian Government and state and territory regulators for approvals. Rewiring the Nation program has committed over $20 billion to upgrade and expand the electricity grid, with major transmission projects like HumeLink underway, concessional finance delivered via the Clean Energy Finance Corporation, and state partnerships supporting renewable integration and grid reliability. | Major Public Infrastructure Pipeline demand
Energy
|
| Future opportunities | |
1. Governments could further accelerate the energy transition by exploring options to:
| |
| 2. Boost materials supply | |
|---|---|
| Progress over last 12 months | Current state – key findings |
|
|
| Future opportunities | |
2. Governments could consider measures to ensure fabricated steel products used in infrastructure projects consistently meet Australian Standards by:
| |
| 3. Boost labour supply | |
|---|---|
| Progress over last 12 months | Current state – key findings |
|
|
| Future opportunities | |
3. Governments and industry could explore opportunities to coordinate and align emerging training programs across jurisdictions to accelerate the development of priority construction workforce skills in digital technologies, modern methods of construction, and decarbonisation. This alignment could include sharing lessons learned, promoting standard approaches to course design delivery and facilitating cross-jurisdiction recognition of prior learning for unaccredited training to improve workforce mobility. | |
| 4. Lift construction productivity | |
|---|---|
| Progress over last 12 months | Current state – key findings |
|
Subcontracting
Workforce diversity — women’s participation
Uptake of technology & modern methods of construction
|
| Future Opportunities | |
4. Governments could explore ways to embed innovation in infrastructure project delivery to unlock significant productivity gains across the construction sector. This could include:
| |
Introduction
The annual Infrastructure Market Capacity reports respond to a request made by the Prime Minister and First Ministers in 2020: that Infrastructure Australia work with jurisdictions and industry bodies to monitor the infrastructure sector.
“Leaders considered analysis on the market’s capacity to deliver Australia’s record pipeline of infrastructure investment to support the country’s growing population. This analysis highlighted the importance of monitoring infrastructure market conditions and capacity at regular intervals to inform government policies and project pipeline development. Leaders agreed that Infrastructure Australia will work with jurisdictions and relevant industry peak bodies to monitor this sector.”
Source: Council of Australian Government Communiqué,
20 March 2020
The fifth publication on infrastructure demand and supply from Infrastructure Australia
Like the previous four editions of the Infrastructure Market Capacity report, this report examines public infrastructure demand and market supply capacity over five years — in this case, 2024-25 to 2028-29. It provides an updated health check and analysis of our national construction market’s capacity to deliver public infrastructure works. The report is structured as follows:
- Understanding demand: a quantification of total infrastructure demand across five years by sector and project type, and detailed analysis of the Major Public Infrastructure Pipeline including year-on-year changes and escalation costs.
- Non-labour supply: an appraisal of the main supply-side risks to market capacity today, including industry views gleaned from interviews and surveys conducted for this report. The focus is on materials supply, which is the largest non-labour supply category by cost shares.
- Labour and skills supply: estimates of infrastructure construction labour supply and shortage by jurisdiction and occupation groups.
- Industry productivity: analysis of the current state of the construction industry, including productivity trends, supplemented with industry perceptions obtained from our 2025 Industry Confidence Survey.
Continued emphasis on policy implications with acknowledgement of progress and looking ahead at future directions
The 2023 Infrastructure Market Capacity report introduced 14 recommendations across four areas to actively manage demand, boost materials supply, boost labour supply, and turn around construction productivity. The 2024 Infrastructure Market Capacity report provided an update of market capacity conditions and pointed to future directions for the Australian Government to maintain the momentum for work in progress. This 2025 edition does the same, using those same four recommendation areas to orient a summary of:
- progress to mitigate market constraints over the past 12 months,
- the current state of the market, and
- future directions for the Australian Government to maintain the momentum for work in progress.
A brief explanation of our Market Capacity Program
The Market Capacity Program is an assumptions-based methodology for identifying market capacity risks. It was developed in collaboration with state and territory governments, industry, advisory bodies and other subject matter experts. These partnerships are integral to the ongoing evolution of the Market Capacity Program.
The Market Capacity Program is underpinned by two system components:
The National Infrastructure Project Database
The National Infrastructure Project Database aggregates and organises infrastructure project data supplied by the Australian Government, state and territory governments (public investments), the Australian Bureau of Statistics (housing building activity) and GlobalData (private investments). The following infrastructure sectors are included in the Market Capacity Program:
- Buildings: non-residential buildings for health, education, sport, justice, transport buildings (such as parking facilities and warehouses), other buildings (such as art facilities, civic/convention centres and offices), detached, semi-detached, apartments and renovation activities (using all residential building activities captured in the Australian Bureau of Statistics’ Building Approvals).
- Transport: roads, railways, level crossings, and other transport projects such as airport runways.
- Utilities: water and sewerage, energy and fuels, gas and water pipelines.
- Resources: base metals, precious metals, critical minerals, hydrogen and ammonia, chemical and pharmaceutical plants, oil and gas, and ports.
Market Capacity Intelligence System
The Market Capacity Intelligence System is a set of analytical tools that interrogates and visualises project demand by sector, project type and resource inputs, for the following infrastructure pipelines:
- Major Public Infrastructure Pipeline: Publicly-funded infrastructure projects valued over $100 million in New South Wales, Victoria, Queensland and Western Australia, and over $50 million in South Australia, the Australian Capital Territory, the Northern Territory and Tasmania.
- Small Capital Public Infrastructure Pipeline: Publicly-funded infrastructure projects valued $100 million and under in New South Wales, Victoria, Queensland and Western Australia, and $50 million and under in South Australia, the Australian Capital Territory, the Northern Territory and Tasmania.
- Private Infrastructure Pipeline: Privately-funded public infrastructure, such as a wind farms, that are funded, delivered and operated by the private sector.
- Private Buildings: Residential and non-residential buildings projects.
- Road Maintenance: Resource demands for road-maintenance projects.
Industry confidence research
Supporting the quantitative analysis research each year, Infrastructure Australia also undertakes industry research to gauge industry confidence levels and better understand their perspectives on current market conditions. Three surveys were undertaken of Australian businesses in the building and construction industry, supplemented with in-depth interviews:
- The 2025 Industry Confidence Survey (n=200) captured views across the infrastructure life cycle, across identification/planning, design, construction, operations and management. The survey sample were actively delivering contracts that ranged in value from less than $10 million (64%), between 10m million and $100 million (23%), and more than $101 million (13%) over the last 12 months.
- The Civil Contractors Federation Survey of its members conducted in 2025 (n=134) captured views of civil construction businesses, comprised of majority (63%) smaller Tier-3 and Tier-4 businesses with annual turnover of less than $100 million.
- In-depth interviews (n=20) with randomly selected building and construction businesses, with each tier represented, to get a more detailed understanding of the key issues for the year.
All states and territories were represented in this year’s industry surveys, with responses broadly reflecting the geographic distribution of the construction industry — most in New South Wales and Victoria, followed by Queensland, Western Australia and South Australia, and the smaller jurisdictions Australian Capital Territory, Tasmania and the Northern Territory.
Detailed methodologies in Appendices
See the Supporting Appendices for detailed explanations of the Market Capacity methodology:
- Appendix A: Demand-side analysis methodology
- Appendix B: Supply-side analysis methodology
- Appendix C: Infrastructure typecasts
- Appendix D: Resource classifications
- Appendix E: Workforce and skills methodology
- Appendix F: Industry confidence surveys
SECTION 1 SUMMARY: Understanding demand
Active demand management - future opportunities
- Governments could further accelerate the energy transition by exploring options to:
- Enhance future updates of the National Renewable Energy Priority List with more detailed project level information — such as funding committed, planning milestones, and delivery stages. This could provide industry with greater certainty about the forward pipeline, supporting more effective planning, investment, and capacity building across the supply chain.
- Establish an environmental approvals concierge, similar to the Investor Front Door function under the Future Made in Australia package, to provide early guidance and facilitation for significant infrastructure projects. This concierge could:
- help state and territory government proponents identify whether EPBC Act approval is required during early project scoping,
- clarify and promote the use of bilateral assessment pathways, and
- connect proponents with relevant Australian Government agencies and resources to facilitate the approval process
Summary
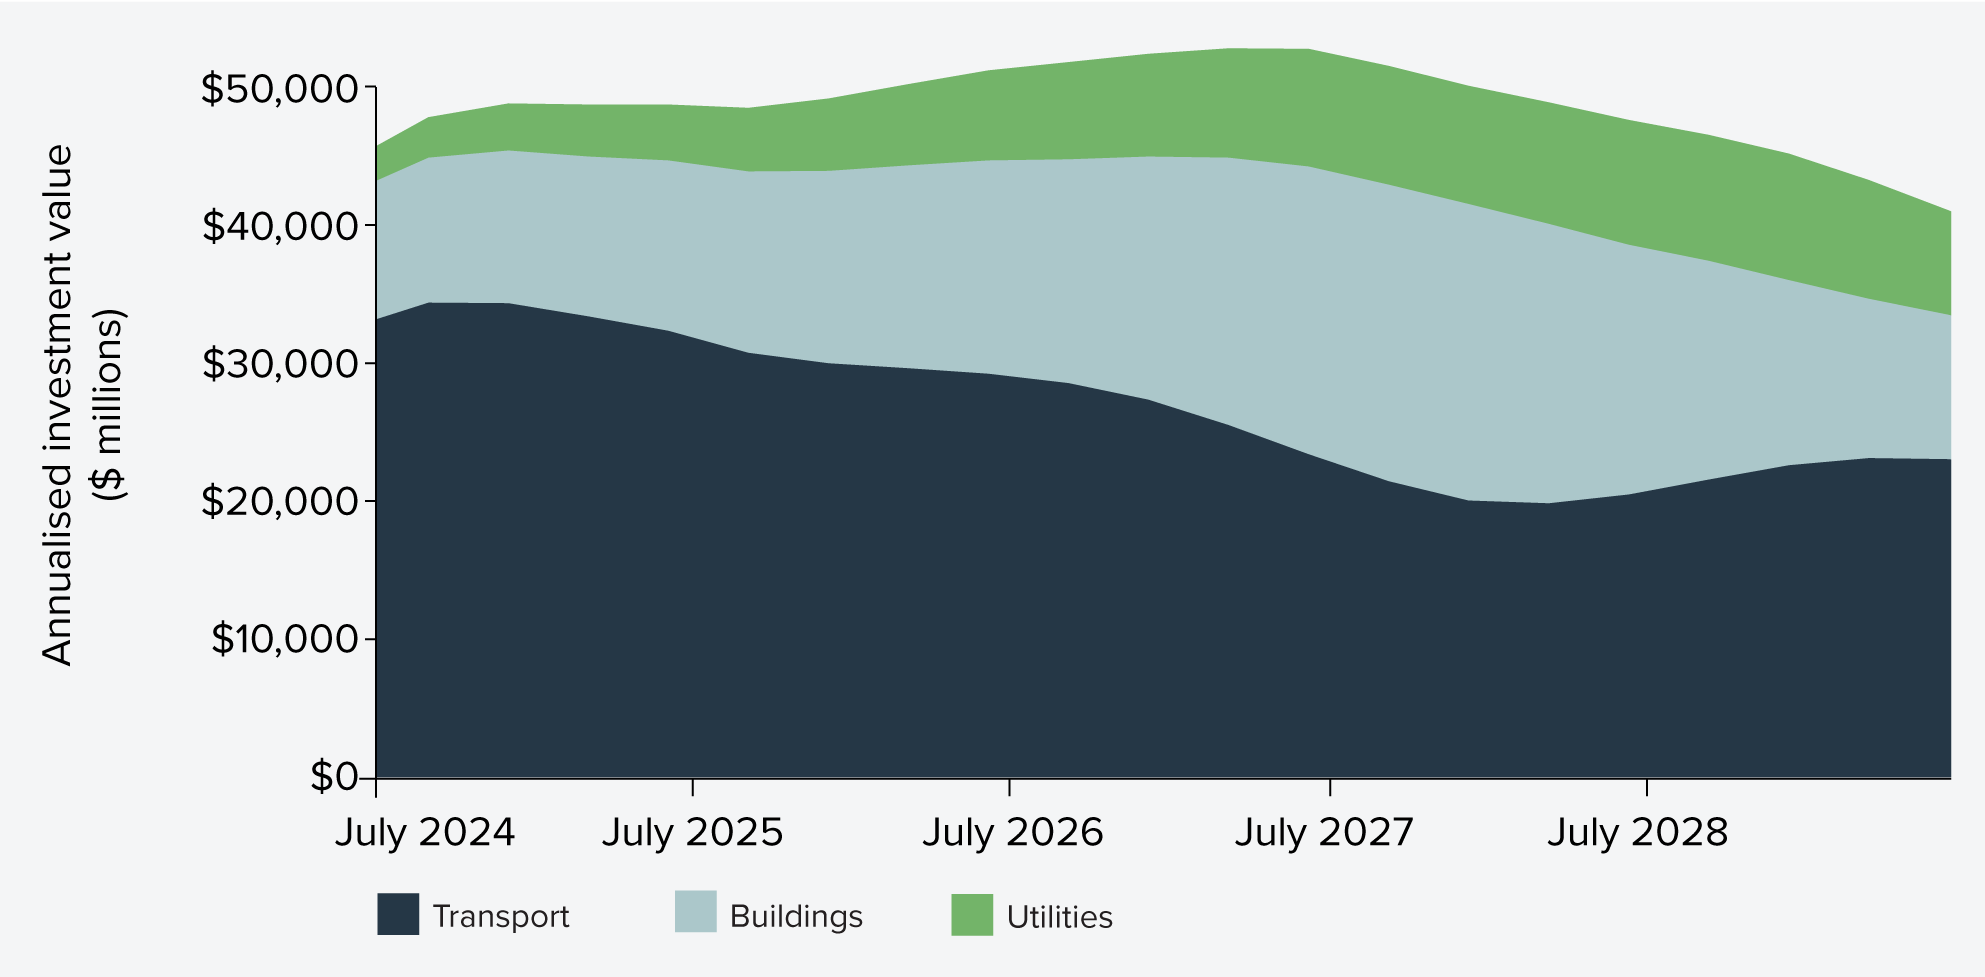
- The Major Public Infrastructure Pipeline (MPIP) has grown to $242 billion for 2024–25 to 2028–29, up 14% from last year’s outlook, reversing previous declines.
- Growth is driven by new projects added to the pipeline, particularly in housing and energy transmission.
- Transport remains the largest category at $129 billion (53%), while buildings have increased to $77 billion (32%), led by residential and health projects.
- Utilities investment has more than doubled to $36 billion (15%), reflecting the addition of several large transmission projects.
- The demand profile shows peak investment shifting to 2027, with stronger certainty in outer years compared to previous reports.
- Regional demand is rising sharply, especially in Queensland, Northern Territory, South Australia, and New South Wales, with some regions expected to more than double current construction activity in the next four years.
- The slow progress on privately funded renewable energy projects from planning to delivery continue to delay the anticipated ramp up in demand for resources into the future, creating uncertainty and slowing workforce investment.
SECTION 1: Understanding demand
More than a trillion dollars in construction activity anticipated over five years is captured in Infrastructure Australia’s data
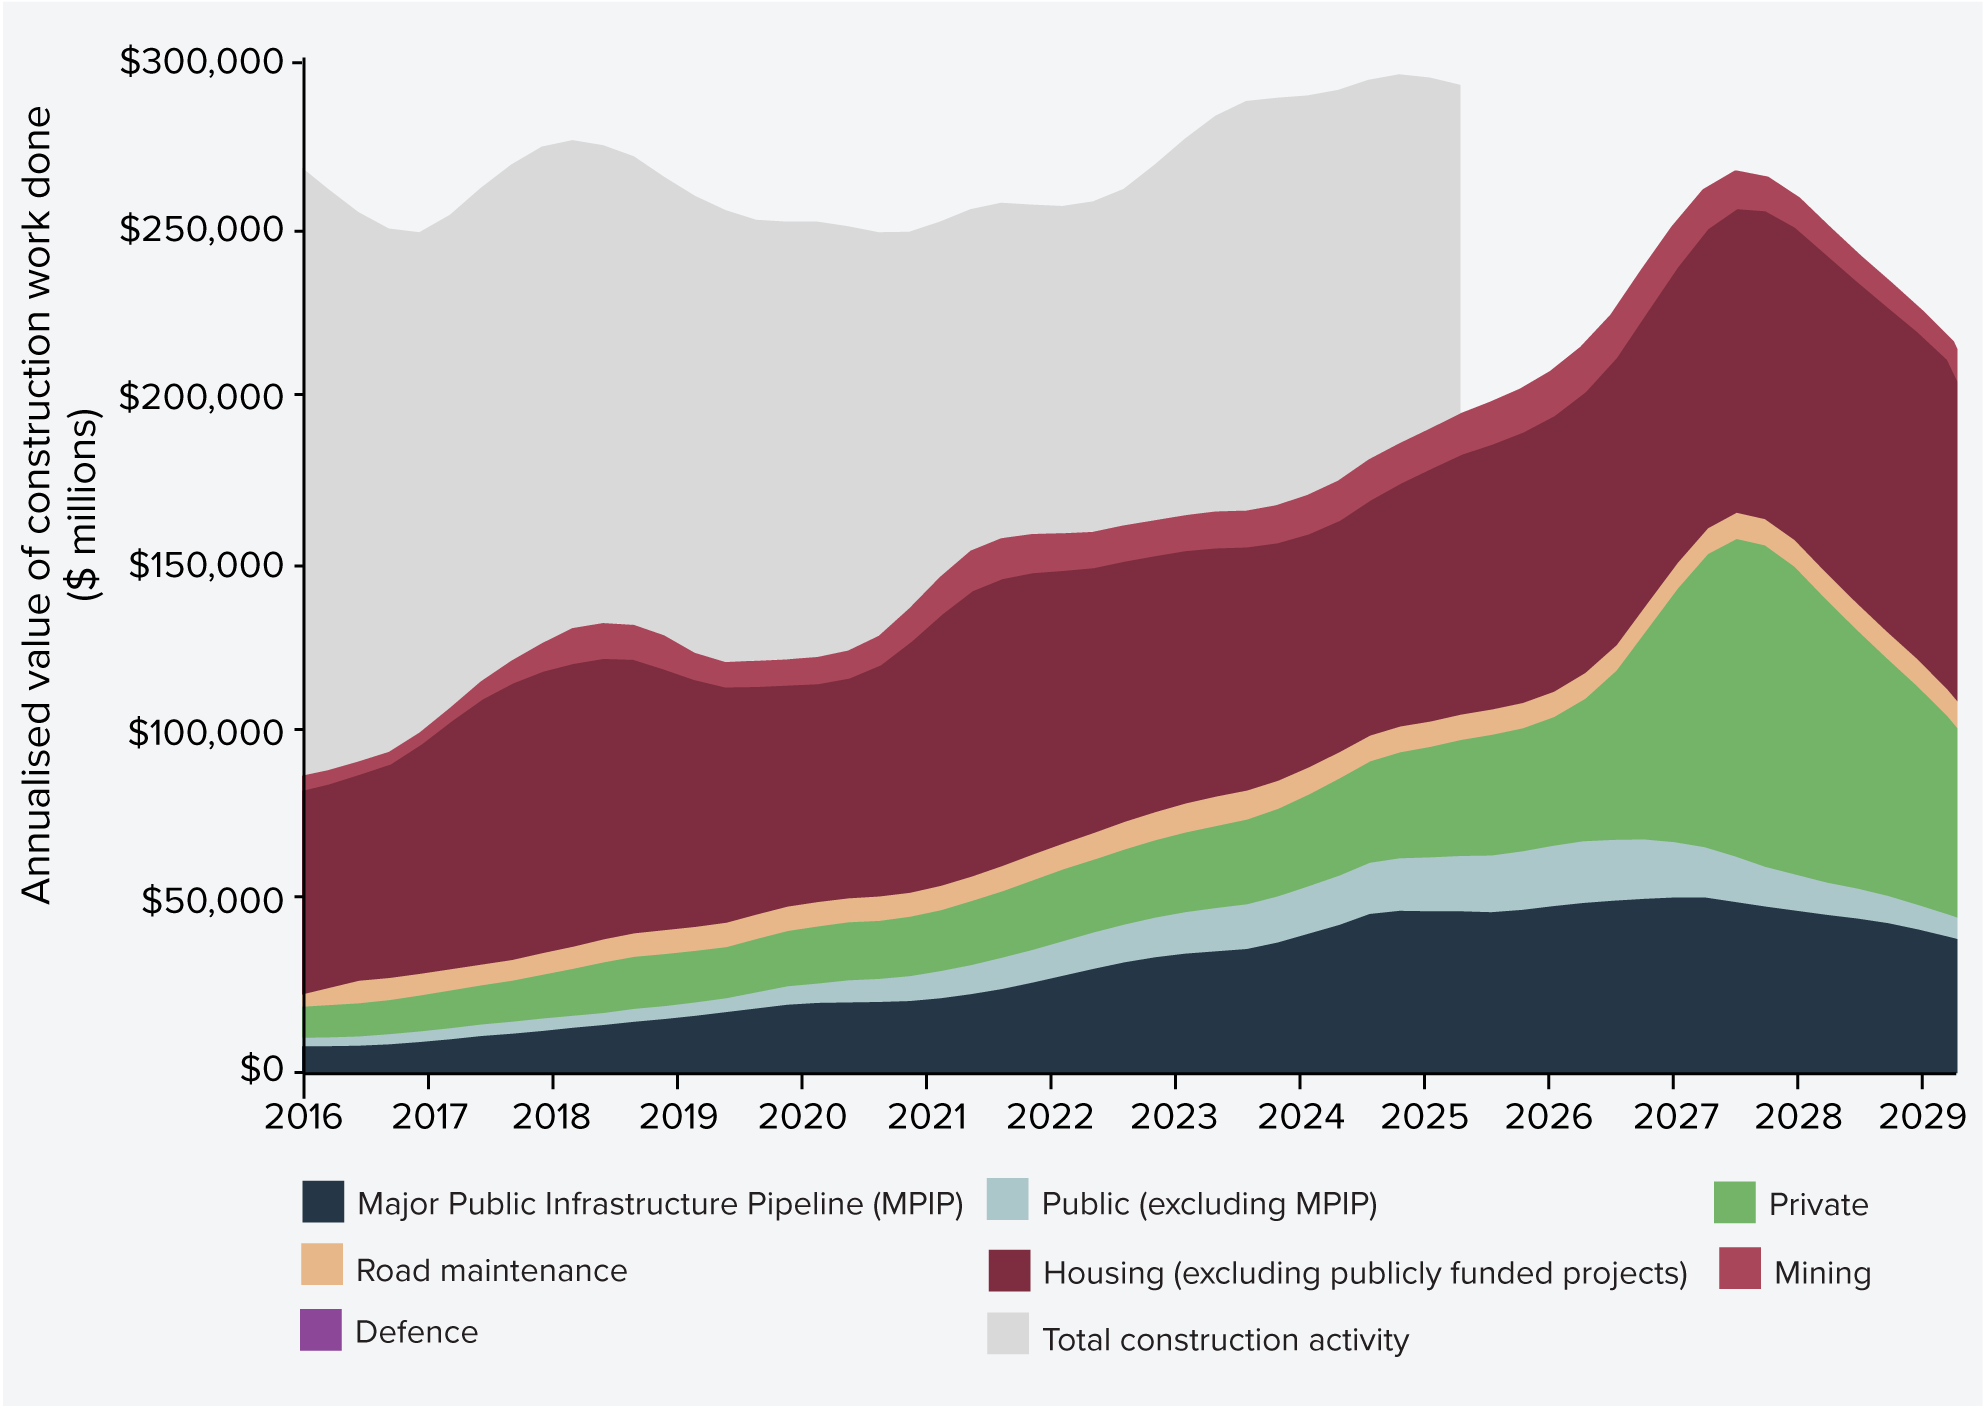
Figure 1 shows Australia’s forecast of construction activity based on project cost estimates, compared against total construction activity reported by the Australian Bureau of Statistics (ABS). The key distinction is that ABS data (shown as ‘Total construction activity’) reflects actual costs, including the impact of cost escalations, whereas Infrastructure Australia’s database (comprising the ‘MPIP, SCPIP, Road Maintenance, Mining, Private, and Housing pipelines) uses cost estimates with limited certainty about future escalations. This difference makes it challenging to determine the exact share of total activity captured by our forecast. However, this comparison does indicate our forecast construction volumes peaking in 2027 at levels comparable to current ABS-reported activity.
While not all projects in our database are expected to proceed as announced, this provides valuable insight into market ambition over the coming years.
Figure 1: Forecast construction spend, as captured in the Infrastructure Australia database, against a backdrop of historic total construction activity (2016 to 2029)
Source: Australian Bureau of Statistics (for total construction activity)5
Total construction demand captured in our database covers $1.14 trillion in the five years from 2024–25 to 2028–29. This level of forecast activity is almost in line with current run rates where the total construction activity reported by the Australian Bureau of Statistics in the five years from 2020–21 to 2024–25 was $1.4 trillion.
Figure 2 shows the total infrastructure pipeline, as captured in our database, broken down by sector. Buildings account for most of the expected expenditure (62%), followed by transport (17%), utilities (16%) and resources (5%).
Of the $716 billion in buildings, $77 billion is from the Major Public Infrastructure Pipeline, with another $48 billion invested in smaller capital buildings projects by governments, totalling $116 billion of public investment. Figure 2 includes a breakdown of this public investment in buildings, which is dominated by residential and health projects.
Figure 2: Combined construction pipeline, as captured in the Infrastructure Australia database, by sector (2024–25 to 2028–29)
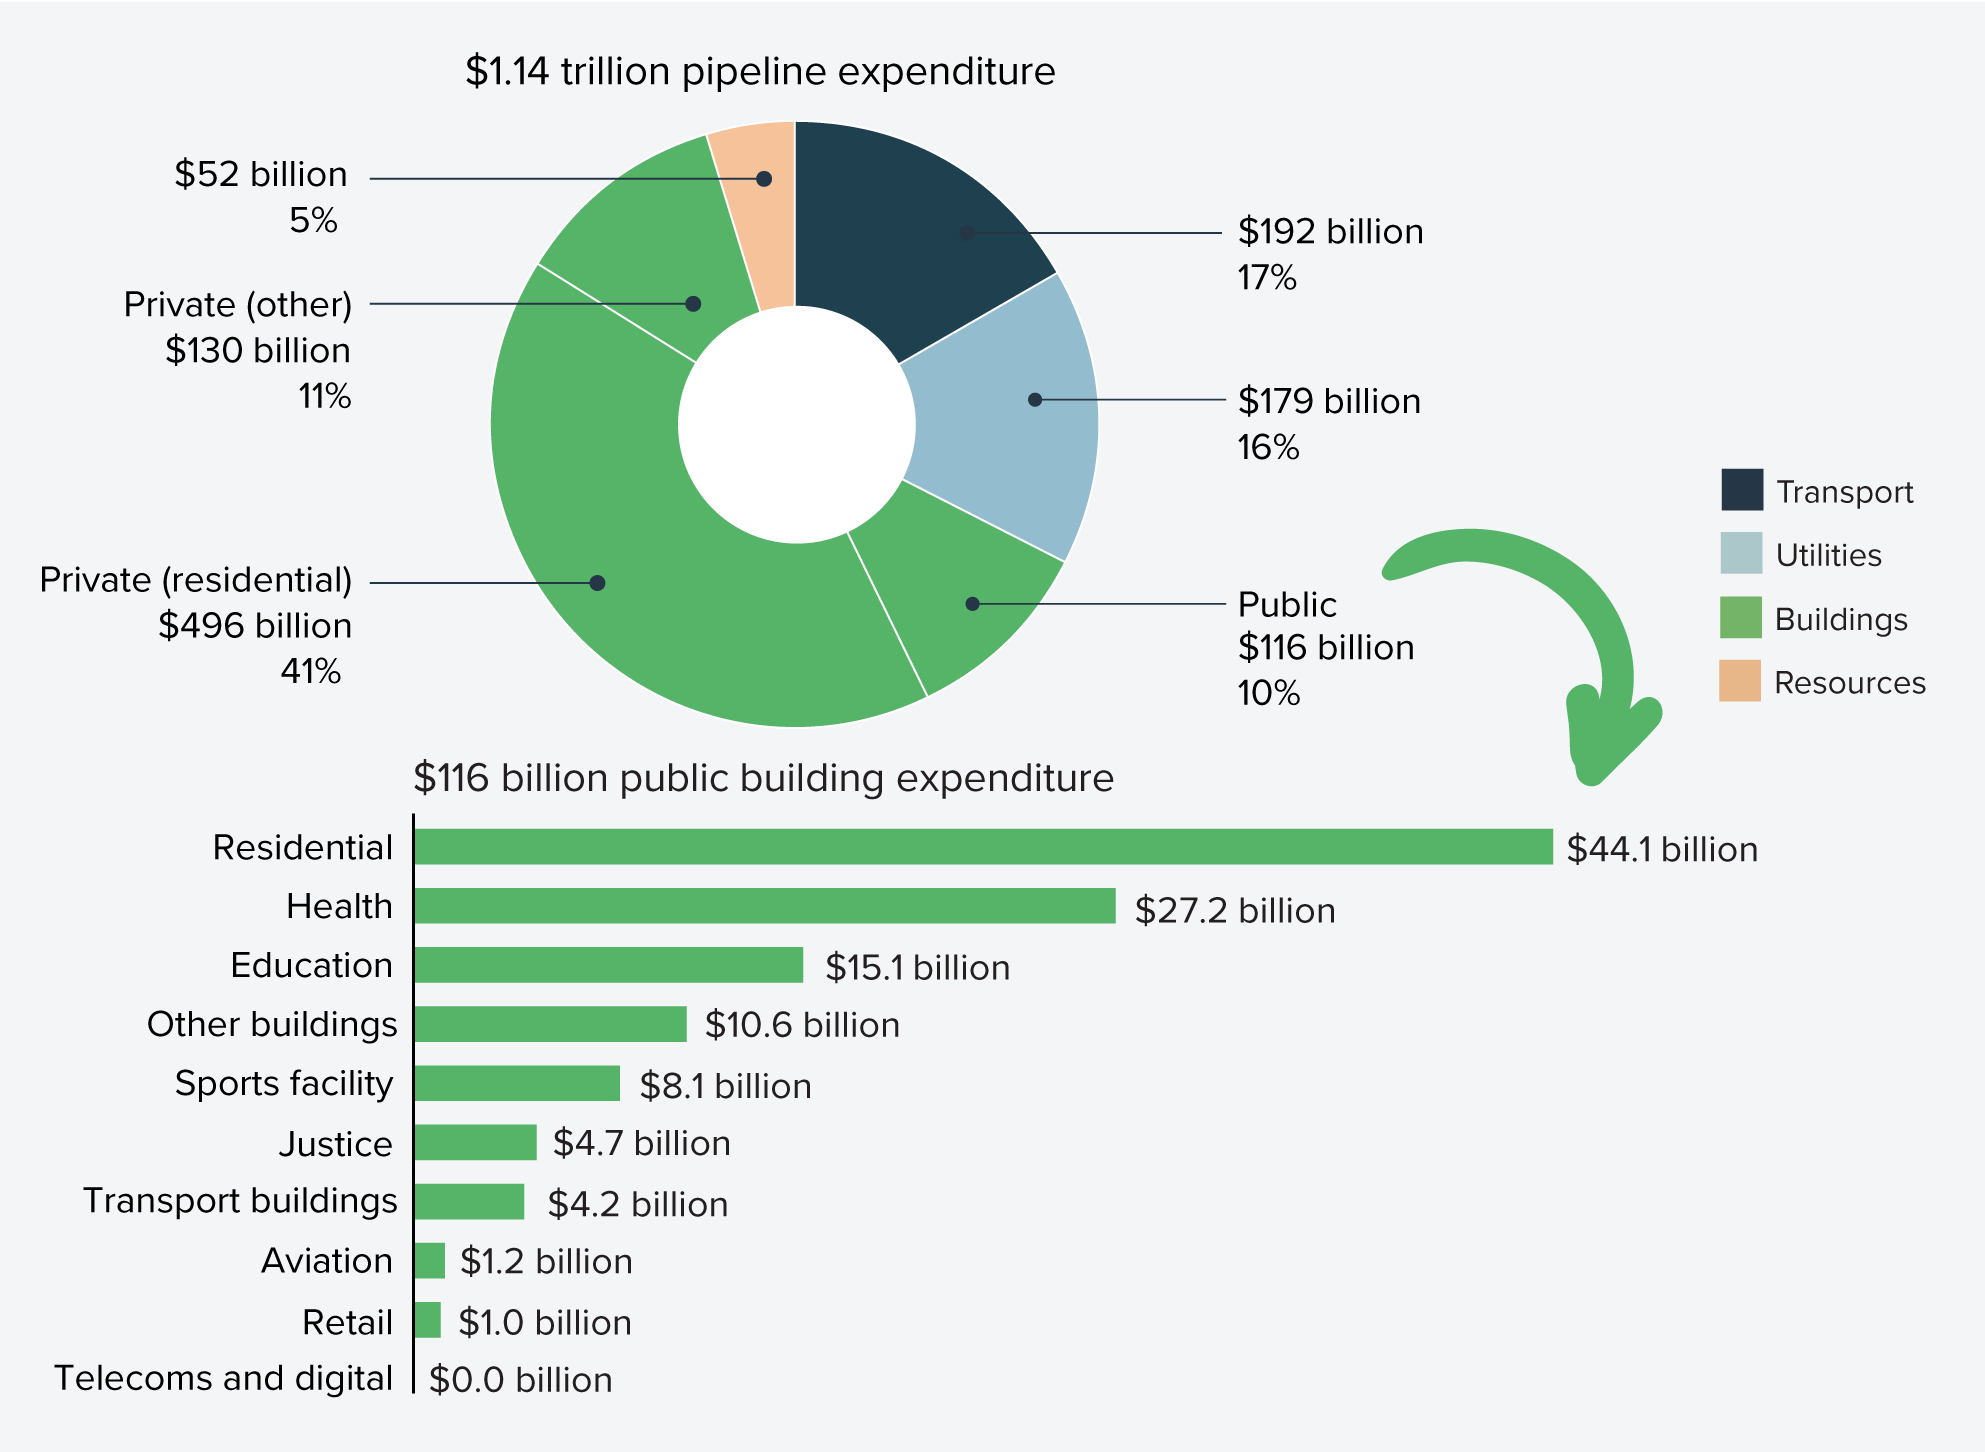
For the period 2024–25 to 2028–29, public spending accounts for 28% of the $1.14 trillion construction market, of which the Major Public Infrastructure Pipeline totals $242 billion (22%) and $66 billion (6%) is planned on Small Capital Projects. The rest of this chapter provides an analysis of the Major Public Infrastructure Pipeline.
The five-year Major Public Infrastructure Pipeline has increased by 14% to $242 billion, reflecting national priorities for housing supply and the energy transition
The five-year rolling Major Public Infrastructure Pipeline has increased from $213 billion projected last year (2023–24 to 2027–28) to $242 billion this year (2024–25 to 2028–29).
This increase reverses the trend previously observed in 2023 and 2024 where year-on-year reductions in forecasted spending were reported:
- 2023 Infrastructure Market Capacity reported $230 billion down from $237 billion in 2022.
- 2024 Infrastructure Market Capacity reported $213 billion down from $230 billion in 2023.
The rise is reflective of national priorities to supply more housing and accelerate the energy transition. For publicly-funded projects we continue to see the transport portfolios across Australian states and territories hold steady, with governments continuing to grow investments in buildings, particularly for health and housing outcomes. Meanwhile, the growth in public-funded utilities infrastructure is predominantly explained by the addition of transmission projects in support of the energy transition.
Peak investment has moved one year out to 2027 compared to the projection last year. These changes are consistent with a continuing trend each year where the projected investment peak shifts into outer years.
The profile of demand over the five years has flattened compared with the 2024 profile. In fact, for the first time, our reporting shows that the outer year, 2028-29, falls away to a level that is more than 75% of the peak. In prior years, this drop in outer years has been anywhere between 50% and 60% of the peak. While this does not translate to long-term project certainty, it is a strong indication of long-term investment certainty in public infrastructure projects.
Like-for-like analysis of how project estimates have changed in the past 12 months shows the growth in demand is primarily driven by projects recently added to the pipeline
Infrastructure Australia conducted an in-depth year-on-year analysis, looking for differences in the investment schedule for projects in the Major Public Infrastructure Pipeline between 2024 estimates and 2025 estimates over the same five-year period (2024-25 to 2028-29 as shown in Figure 3).
Figure 3: Comparison of 2024 and 2025 forecasts of Major Public Infrastructure Pipeline activity (2024–25 to 2028–29)
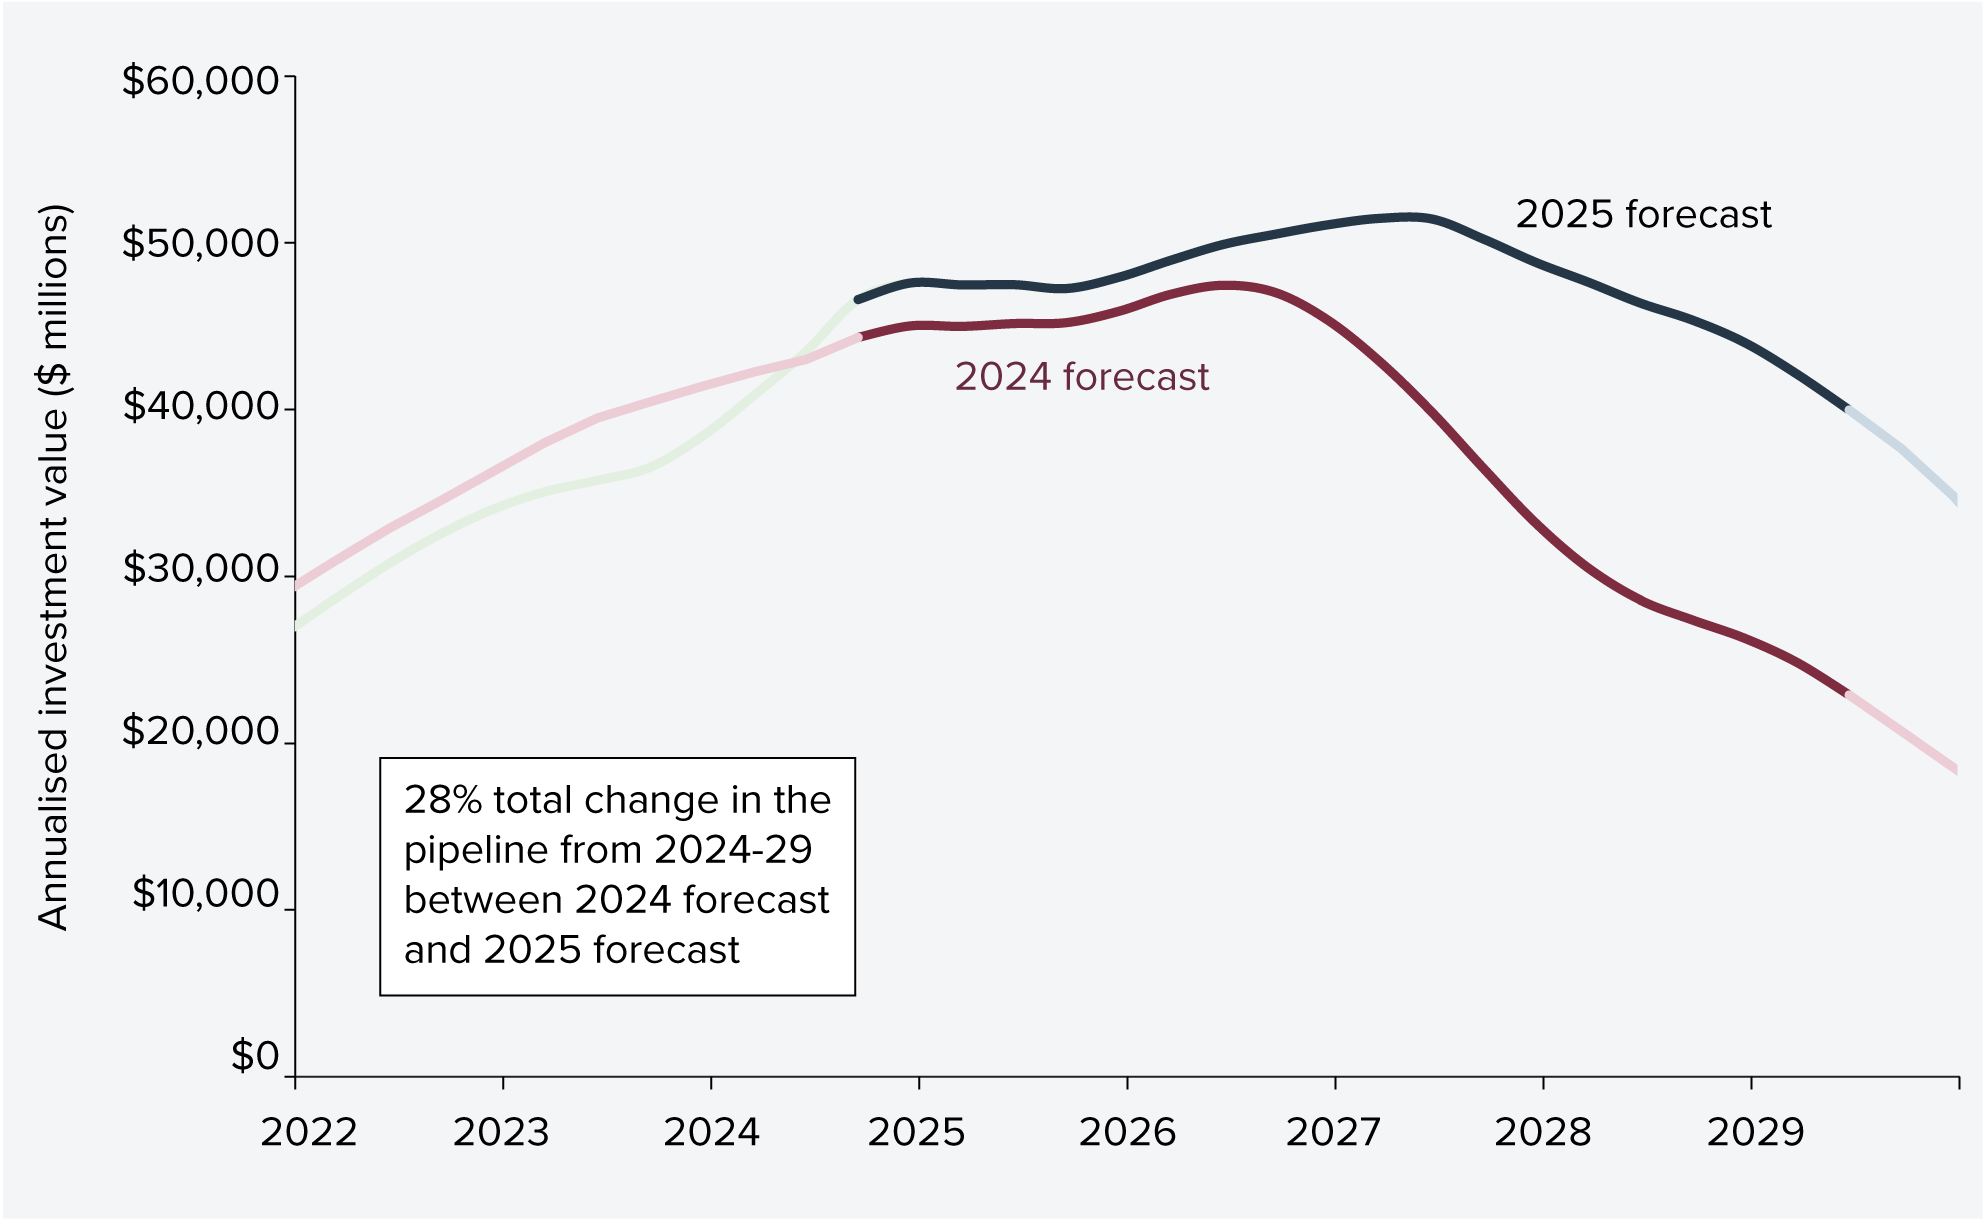
Whereas the change in the rolling Major Public Infrastructure Pipeline described earlier is a 14% increase in activity from $213 billion to $242 billion, this like-for-like analysis is different because it is undertaken on the same time horizon for both the 2024 and 2025 forecasts without rolling on by one year, so the proportion of the 2024 forecast analysed is $189 billion.
The analysis reveals the pipeline decreases by 8% due to projects being removed or recently completed, as shown in Figure 4. A further 1% drop was observed from investment cuts in continuing projects. At 9% down, this is significantly less than the 23% reductions observed 12 months earlier for both categories.
Increases to the pipeline were driven primarily by new projects coming into the pipeline (17%) which is well up on the previous year, while the increase explained by investment estimates (10%) was broadly in line with changes observed in prior years.
The remaining category that drives a change when comparing year on year, is explained by schedule changes to projects, where construction start and/or completion is delayed. This has the effect of lessening the investment in the time period that has already passed (2023-2024), and propping up the investment planned for the outer years of the time periods compared. It results in a 10% increase versus 2024 estimates.
Figure 4: Major Public Infrastructure Pipeline spend from 2024–25 to 2028–29, changes from 2024 forecast to 2025 forecast
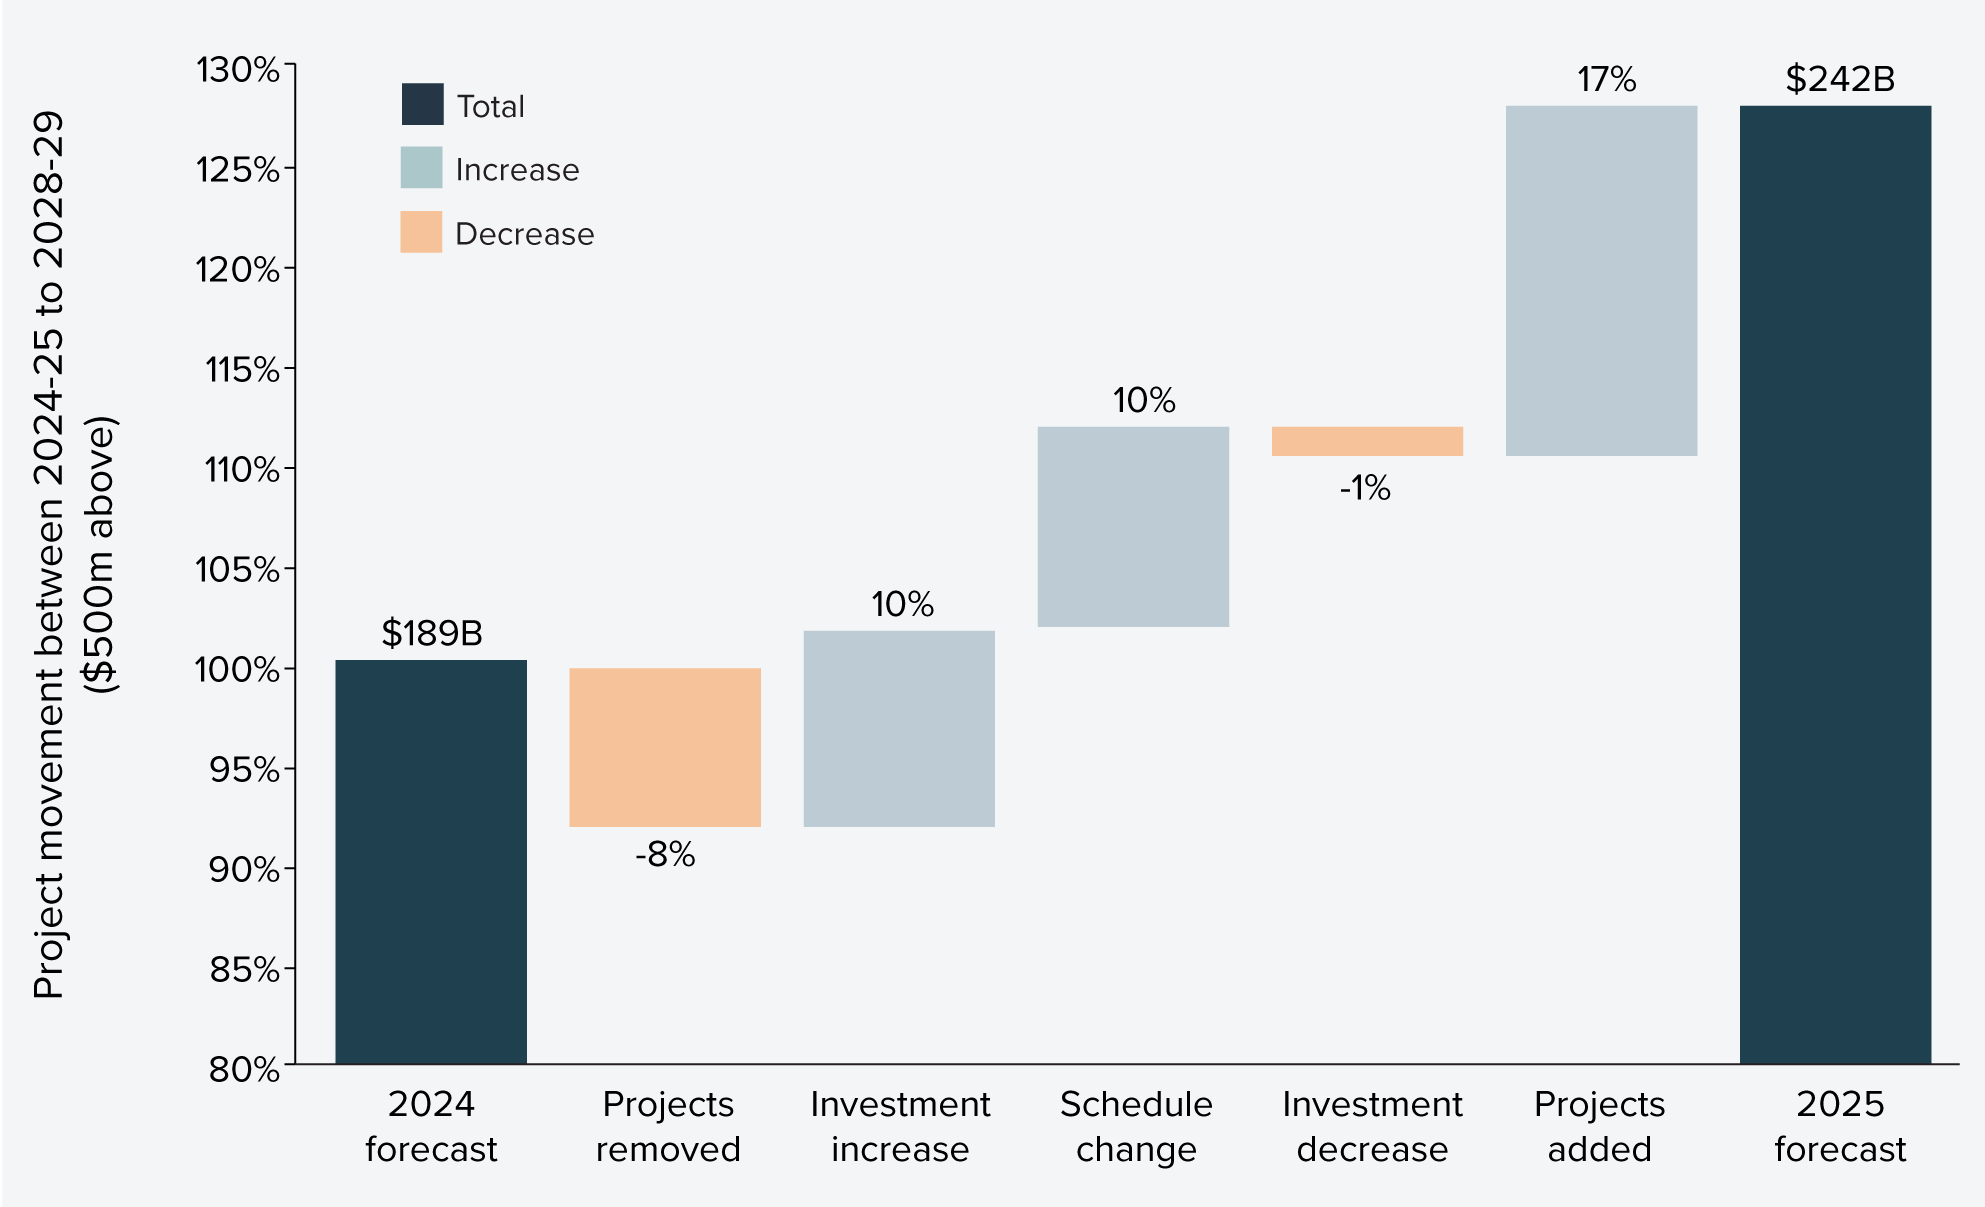
In summary, this year’s growth in the Major Public Infrastructure Pipeline is largely explained by many more new projects being added, compared to what has rolled off the pipeline from project completions and cancellations. Other categories are broadly in line with the findings from previous years, however it is noted that there was significantly less change attributable to decreases in a project’s investment, an indication that there was less focus on de-scoping within projects throughout the past 12 months than was observed in the year prior.
Analysis of demand by region sees further growth across northern Australia
Regional analysis is enabled by the development in 2023 of analytical tools built by Infrastructure Australia in partnership with governments across the country. These analytical tools are designed to help government decision makers diagnose labour supply bottlenecks, spot growth opportunities, and build strong evidence bases for investment decisions.
In the five years from 2024-2025 to 2028-2029, there are significant increases in public investment across Queensland and Northern Territory for the second consecutive year with Major Public Infrastructure Pipelines growing by another $4 billion to $51 billion, after a $16 billion increase the year before.
In Queensland the increases are driven by investments across the transport and utilities portfolios, predominantly explained by additional construction activity in the Sunshine Coast and Wide Bay regions. The upcoming demand for construction from 2025-26 to 2028-29 across these two neighbouring regions is more than four times that of the previous four years from 2021-22 to 2024-25.
In the Northern Territory the increase is driven by transport investment in the Greater Darwin area.
Growth across either housing or energy is evident in all states and territories
The jurisdictions driving an even higher proportion of the overall increase this year are New South Wales and South Australia with an additional $26 billion in the five-year outlook compared with the year before.
In South Australia the increase is driven by investments into housing across the Greater Adelaide area, while the transport portfolio increases as construction activity ramps up during the outlook period on its River Torrens to Darlington Project.
In New South Wales the increase is driven by the utilities portfolio with water and transmission projects added to the pipeline.
While most energy projects in the pipeline are privately-funded and therefore not counted in the Major Public Infrastructure Pipeline, governments across Australia are putting significantly more investment into transmission. Transmission projects now account for $15 billion across the five-year outlook, up from $4 billion the year before. The increases are observed across five of eight states and territories.
Similarly, investment into social and affordable housing as part of the Major Public Infrastructure Pipeline has increased and is now $28 billion up from $17 billion. When also considering smaller capital projects, there are six out of eight jurisdictions that have increased their investment into housing.
Figure 5: Major Public Infrastructure Pipeline spend by sector (2024–25 to 2028–29)
The projected increase in demand for many regional areas would intensify local supply chain constraints such as attracting workers and sourcing materials
The Major Public Infrastructure Pipeline comprises $63 billion of activity outside of Australia’s eight capital cities, which at 27% of the pipeline is broadly in line with Australia’s population distribution. This is up from $58 billion last year which means the increase is in line with the size of the increase across capital cities.
Unlike most capital cities, 10 regions across Queensland, New South Wales and Tasmania face a significant challenge with the Major Public Infrastructure Pipeline in each expected to more than double between 2025-26 and 2028-29, compared with the previous four years (2021-22 to 2024-25). For this analysis, Infrastructure Australia uses Australian Bureau of Statistics’ Statistical Area 4 as the boundary between regions. Of all 41 regions outside of capital cities, 23 of them will see an increase in construction activity in the coming four years across, and these regions are located across all six states and the Northern Territory.
The challenges to be overcome with respect to the growing construction demand outside of capital cities are more pronounced when analysing the energy pipeline.
The Energy Pipeline
In terms of private investment (that is, not counted in the Major Public Infrastructure Pipeline) we again observed a jump in labour demand much like that observed in the previous edition of this report. This step-change in labour demand is driven by the renewable energy transition. However, this year’s demand profile shows workforce demand now projected to rise sharply from early 2026, around 18 months later than earlier forecasts, which had anticipated growth from mid-2024, as shown in Figure 6.
Figure 6: Comparison of 2024 and 2025 forecasts of demand for labour from private infrastructure
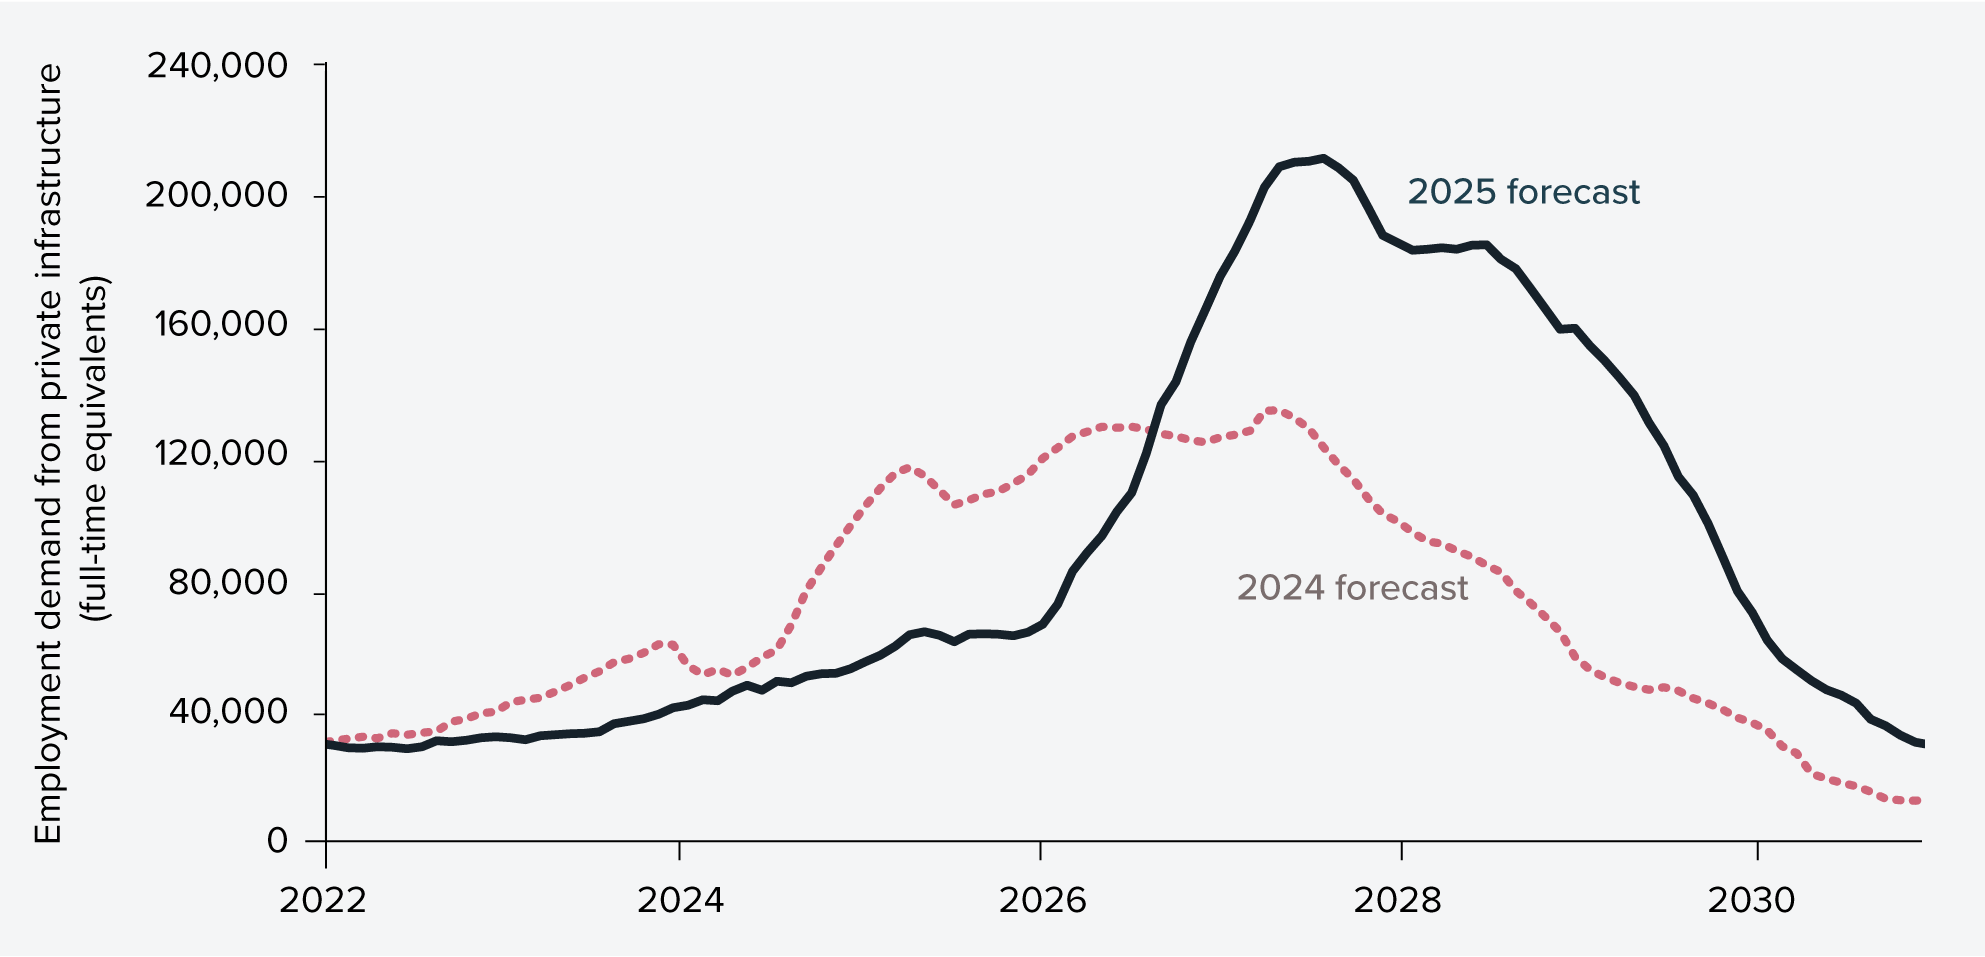
Notes: Chart represents forecast labour demand data based on private infrastructure, excluding resources
The scale and pace of ambition in the pipeline faces delivery challenges
It is clear that energy infrastructure investment continues to shift to the right due to delays to the planned delivery timelines initially expected by project developers.
This is reinforced by analysis from Infrastructure Partnerships Australia of the Australia and New Zealand Infrastructure Pipeline (ANZIP — see below). Infrastructure Partnerships Australia has assessed the likelihood of energy projects achieving planned delivery schedules based on a range of criteria including the status of project financing, planning approvals, final investment decisions and signing of contracts. The results of this analysis were clear, that publicly-procured road, rail and social projects are much more likely to stick to their plans than energy projects. The analysis characterises 58% of the 298 energy projects included on ANZIP as having a low to moderate likelihood of being delivered to the project schedule, relative to the other energy projects on ANZIP.6
About the Australia and New Zealand Infrastructure Pipeline (ANZIP)
The ANZIP is produced by Infrastructure Partnerships Australia as a continuously updated forward view of major infrastructure projects and contracts across Australia and New Zealand. It provides a transparent, detailed and independent snapshot of infrastructure project investment, construction, operation and privatisation opportunities that Infrastructure Partnerships Australia tracks from announcement to completion.
The key distinctions between Infrastructure Partnerships Australia’s ANZIP and IA’s National Infrastructure Project Database analysed for this report are best explained by these two factors:
- ANZIP tracks projects from their early stages of planning, through to contract award, and into their operational phase, this means there is more breadth to project information retained in ANZIP.
- ANZIP’s Australian projects cover projects and operations that are A$300 million and over, and Public Private Partnerships and investable projects and divestments that are A$100 million and over. This means there are less projects in ANZIP than analysed in IA’s database.
Notwithstanding delivery challenges, the ambition for investment in energy projects continues to grow, with a focus in regional areas
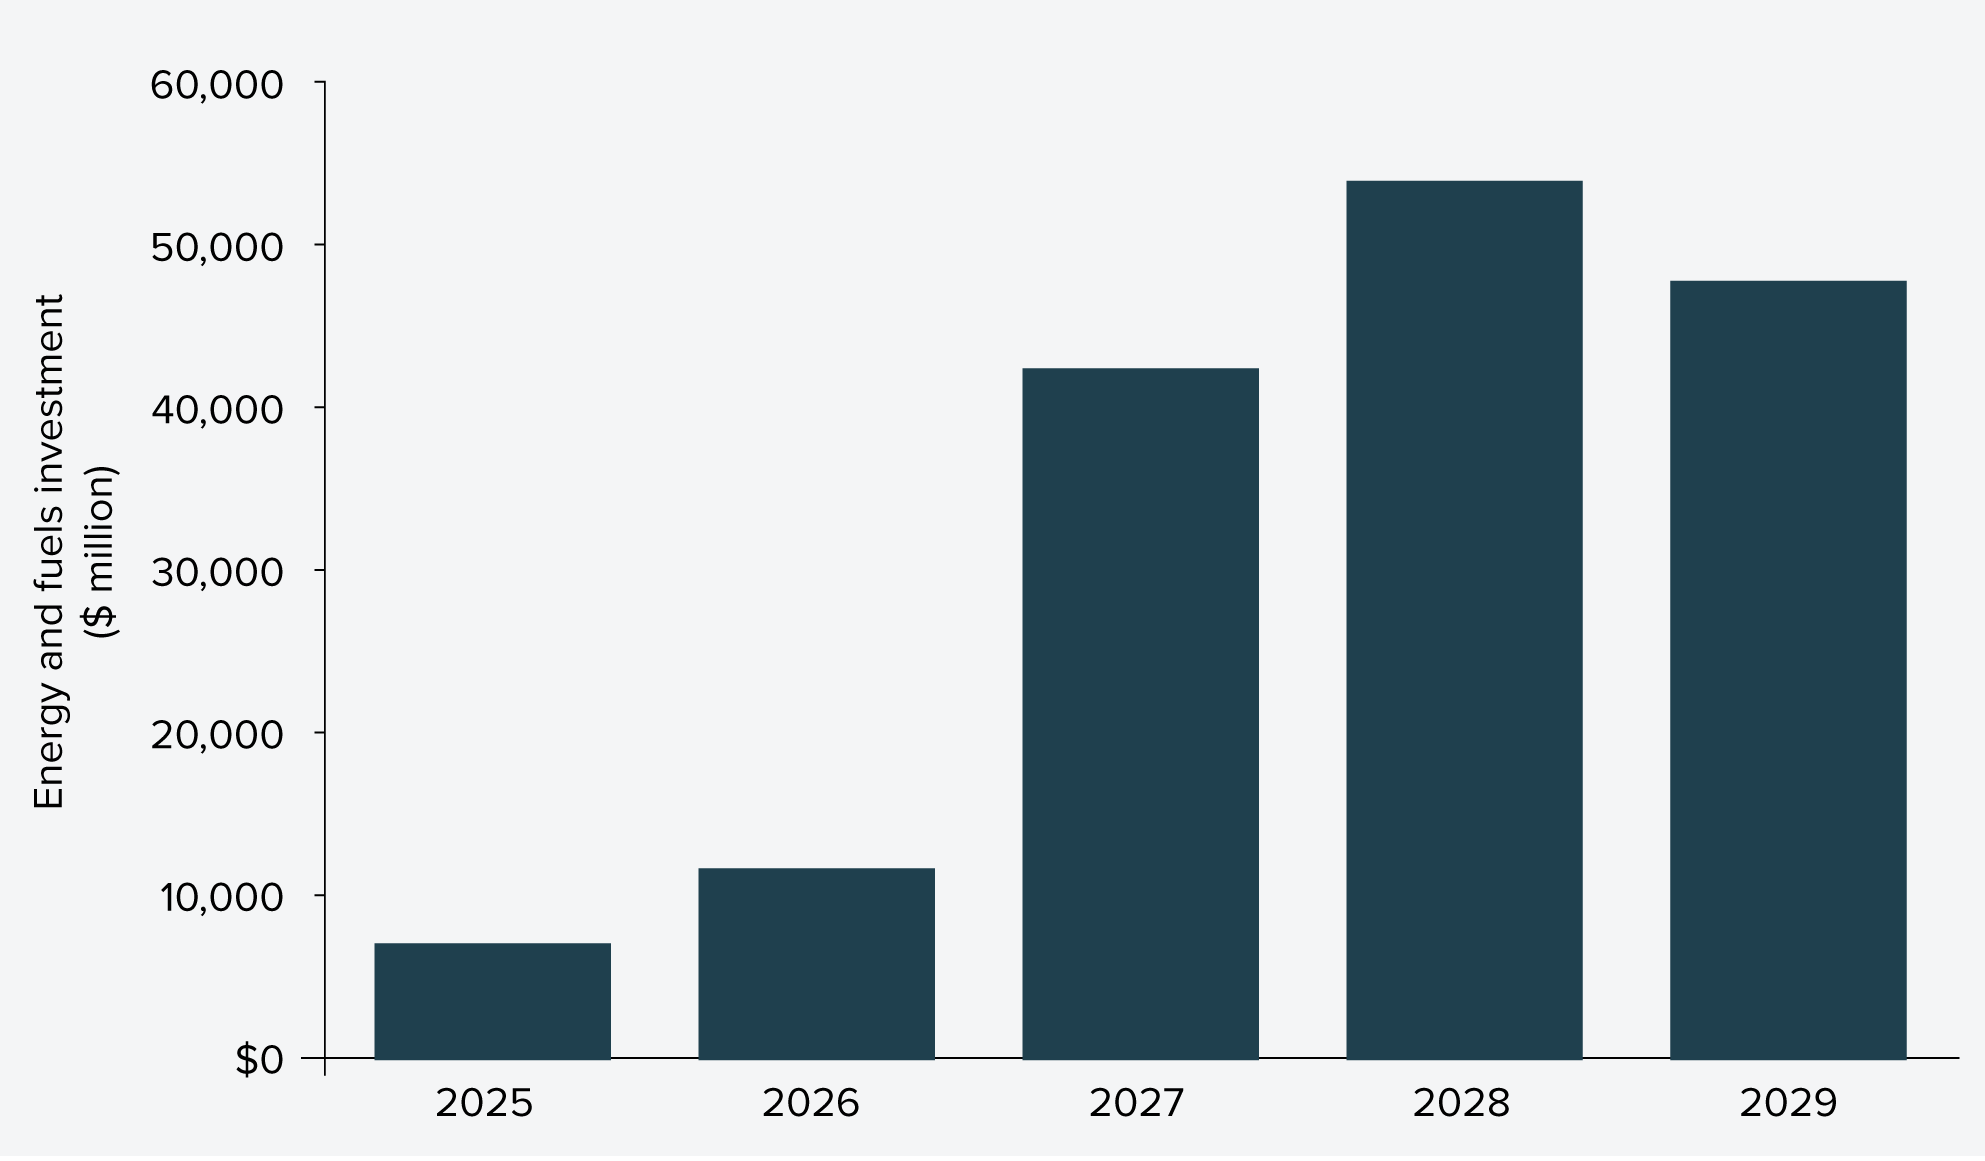
As the net zero transition accelerates, the scale of energy infrastructure investment continues to grow. Irrespective of how it is funded, the pipeline for projects to build transmission, solar, wind and pumped hydro is now $163 billion for the five years from 2024-25 to 2028-29, as shown in Figure 7. Demand is expected to be most acute for regional Australia.
Figure 7: Forward pipeline of energy infrastructure investment (2024-2025 to 2028-2029)
Pipeline visibility, accelerating approvals and smoothing supply chains are all key to remove barriers to delivery of energy projects
State and territory governments have made significant strides to provide industry with better visibility of the forward pipeline for major public infrastructure such as transport.7 However, there is no equivalent for the energy sector, which is predominantly private industry-led and as such lacks coordination and is subject to greater commercial sensitivities.
The Australian Government, working with States and Territories, released the inaugural National Renewable Energy Priority List in March 2025. The List identifies 56 priority renewable energy projects that will receive targeted support to streamline regulatory planning and environmental approval processes. However, the list does not include information on funding commitments nor on delivery timelines, limiting industry’s ability to plan, invest, and scale delivery capacity with confidence.
Industry also often cites long planning and regulatory approval times and ‘green tape’ as barriers to progressing energy projects as planned. Almost half all organisations surveyed by Infrastructure Australia this year viewed delays in obtaining planning and environmental approvals (47%) as being among the greatest risks to project delivery.
Industry soundings suggest that in the face of these delays and likelihood that projects will proceed as planned, investors are directing money to overseas renewable energy opportunities and the overseas suppliers may be less willing to service the Australian market when they receive orders for their projects. Local firms are also hesitant to build workforce capacity for work that is yet to fully materialise.
Renewable energy supply chains also face enabling infrastructure and logistical challenges. The import and local transport of large components such as wind turbines can be constrained by existing port or road infrastructure. Some projects face difficulty getting off the ground due to a lack of capacity to connect to the grid. For example, for the South-West Renewable Energy Zone (REZ) in NSW, projects in the pipeline would theoretically deliver 16 gigawatts (GW) of generation capacity. However, the REZ has a maximum capacity cap of 3.98 GW that planned transmission can support.8
INDUSTRY SOUNDINGS
“Two years ago, we were doubling down on gearing up our energy teams ... [now] we are redeploying some of that capacity into parts of Asia and other locations where we are seeing the volume of work hitting the market much more quickly.”
(Constructor)
“All these new entrants to the Australian market are used to developing a couple of hundred-megawatt wind farm somewhere where the legislation requirements, the environmental constraints and the grid connection restraints aren’t as harsh. It’s just harder to do business in Australia because of the regulatory process.”
(Constructor)
Governments are streamlining approvals for energy projects
At the national level, the Australian Government has committed to reforming the Environment Protection and Biodiversity Conservation Act 1999 (EPBC Act) to strengthen environmental protection and streamline approvals. It has committed to introducing the reform package to Parliament in 2025, six months ahead of the original timelines. Regional planning pilots are also currently underway in Queensland, South Australia Victoria and New South Wales. These pilots are providing information and guidance to help streamline assessments and approvals. Some pilots may be developed further to make regulatory plans that allow renewable energy projects in pre-assessed zones to bypass lengthy case-by-case approvals.
State and territory governments have also introduced a range of measures to fast-track approvals for energy projects in response to growing renewable energy targets and infrastructure needs.
For example:
- Western Australia has established a Priority Approvals team to coordinate inter-agency processes, enable parallel assessments, and provide a single point of contact for proponents, reducing delays and improving transparency.
- Similarly, Victoria’s Development Facilitation Program accelerates approvals for renewable energy and storage projects, guaranteeing decisions within about four months to help meet decarbonisation goals.
- The Northern Territory introduced its Approvals Fast Track Taskforce and Tasmania has introduced the Renewable Energy Approvals Pathway (REAP) to accelerate large-scale renewable projects like wind farms and transmission lines.
- Other states, such as New South Wales and Queensland, have implemented planning acceleration programs and priority development areas to cut red tape for critical infrastructure, while still maintaining environmental standards.
Under the EPBC Act, the Australian Government can enter into bilateral agreements with states and territories to streamline environmental assessments for projects that may impact matters of national environmental significance. These agreements allow a state or territory to conduct a single accredited assessment process that meets both state and federal level requirements, reducing duplication and improving efficiency. After the state or territory completes its assessment, it provides a report to the Australian Government, which then makes the final approval decision under the EPBC Act.9
This framework aims to balance high environmental standards while enabling timely project delivery by aligning assessment processes across jurisdiction. While bilateral agreements have been in place with all states and territories since 2015, their application remains low. More could be done to promote the use of the bilateral agreements to streamline approvals processes and remove duplication between state and federal level requirements.
Cross-sector demand management
State and territory governments have increasingly prioritised cross-sector coordination in infrastructure planning and delivery, recognising transport as a key enabler of housing, energy transition, and strategic economic precincts. Coordinator General roles in Western Australia and New South Wales exemplify this integrated approach, aligning transport investments with broader objectives in urban development, energy, and regional growth.
Western Australia
Infrastructure WA (IWA) has taken a proactive role in addressing market capacity challenges across Western Australia, with a particular focus on the Western Trade Coast (WTC) — a nationally significant industrial precinct.
In response to the WA Premier’s mandate, IWA has supported portfolio scheduling and initiated a market capacity pipeline to support coordination of infrastructure delivery across major project delivery agencies including Westport, Department of Transport and Major Infrastructure, Fremantle Port Authority and Water Corporation. This work has already identified a significant uplift in projected construction expenditure through 2028–2040 and the importance of information sharing between State and Commonwealth, including the Department of Defence, on infrastructure planning and delivery.
Building on this momentum, IWA is advancing an analytics program, in close collaboration with Infrastructure Australia, to forecast demand and supply pressures, at both at an aggregate and project-level, for labour, materials, and plant—critical to ensuring on-time, on-budget delivery.
This collaboration is already delivering tangible benefits through testing, calibration and validation of the data, and models, and demonstrates collective leadership and cooperation in infrastructure delivery coordination, data-driven planning, unlocking opportunities for innovation, workforce planning & development (including IA’s Net Zero workstream), and strategic investment across WA and the Nation.
Similarly, the New South Wales Government has strengthened cross-sector coordination for strategic infrastructure projects by expanding the Infrastructure Coordinator-General function within Infrastructure NSW (INSW).10
Since 2024, it has carried an expanded role that includes leading coordination across housing, energy, and employment-related infrastructure priorities, particularly in Western Sydney and the Aerotropolis. This includes aligning planning and delivery timeframes across agencies to reduce delays and duplication.
The Coordinator General also has powers to intervene and resolve roadblocks or disagreements between agencies, ensuring critical projects progress without unnecessary red tape.
Its immediate focus areas include:
- Infrastructure to support housing targets and reforms under the National Housing Accord.
- Coordination of enabling works for the Electricity Infrastructure Roadmap, including transmission and renewable energy projects.
- Freight and logistics infrastructure to unlock employment lands in Western Sydney.
- Aerotropolis Sector Plan: INSW sequences and prioritises transport and water infrastructure to enable development across the Aerotropolis, ensuring integrated planning for roads, utilities, and airport-related growth.
INDUSTRY VIEW SECTION 1: Understanding demand
Current capacity remains similar to last year, but delivery confidence is higher
Similar to 2024, six in 10 organisations view the current market capacity as about the same as last year (60%), one in four (26%) think it is worse, and few (9%) describe it as less challenging.
Industry reports stronger confidence in ability to deliver in the short and longer term. A majority of organisations are confident in their ability to deliver infrastructure projects over the next 12 months (67%), the next two to four years (64%) and in more than five years’ time (56%).
Confidence is notably stronger than in 2024, with one in four organisations (26%) reporting high confidence (‘highly likely’) to successfully deliver infrastructure projects over the next 12 months, double from last year’s survey results.
Industry reports slight uptick in capital activity, with many expecting growth over the next 12 months
More organisations have seen an increase in capital project activity over the last 12 months (31%) than have seen a decrease (23%), however four in 10 (44%) think this has remained about the same. This is similar to last year’s survey results (where 28% reported an increase and 42% reported capital activity had remained about the same over the last 12 months).
When looking at the year ahead, twice as many organisations anticipate an increase in project activity (40%) than expect a decrease (18%). Expectations for the next 12 months largely align with perceptions of recent activity, with the majority of organisations that experienced increased activity over the last year anticipating further growth and those who experienced no change or decreased activity largely expect a continuation of these trends.
Inconsistent pipeline of work in each state and territory predicted to constrain capacity
Over the next 12 months most organisations are concerned by capacity challenges in New South Wales (30%) and Victoria (27%) followed by Western Australia (16%) and Queensland (15%), and the smaller states and territories.
In the longer term, industry anticipates capacity opening in New South Wales and Victoria, as large civil projects progress through the delivery phase and the forward pipeline weakens. However, market capacity is expected to become more constrained in Queensland and South Australia with pipelines firming around the 2032 Brisbane Olympics and key defence projects in those regions.
Industry noted the key issues impacting capacity in specific geographic regions include:
- uncertainty about state / territory government fiscal priorities and forward pipelines, despite continued high demand for infrastructure investment in growing cities.
- delayed or ‘fluid’ start dates, longer approval waits and shorter delivery timeframes in some states, following extended procurement processes in which tenderers compete on both cost and delivery timeframes.
- competition between states to fill labour and skills shortages on large resources and construction projects pushing up costs and compounding shortages in smaller states.
Labour and material supply disruptions remain the leading causes of project disruption
Organisations report that disruptions to project delivery are being driven primarily by cost of materials (64%), cost of labour (63%) and labour and skills shortages (59%), as shown in Figure 8.
Figure 8: Severity of disruptions to project delivery as reported by industry (%)
SECTION 2 SUMMARY: Non-labour supply
Boost materials supply – future opportunities
2. Governments could consider measures to ensure fabricated steel products used in infrastructure projects consistently meets Australian Standards by:
- Setting standards for imported fabricated steel that meet domestic quality and safety standards, and developing a traceability and certification system to track imports, and
- Ensuring compliance with these standards on major infrastructure projects across the country.
Summary
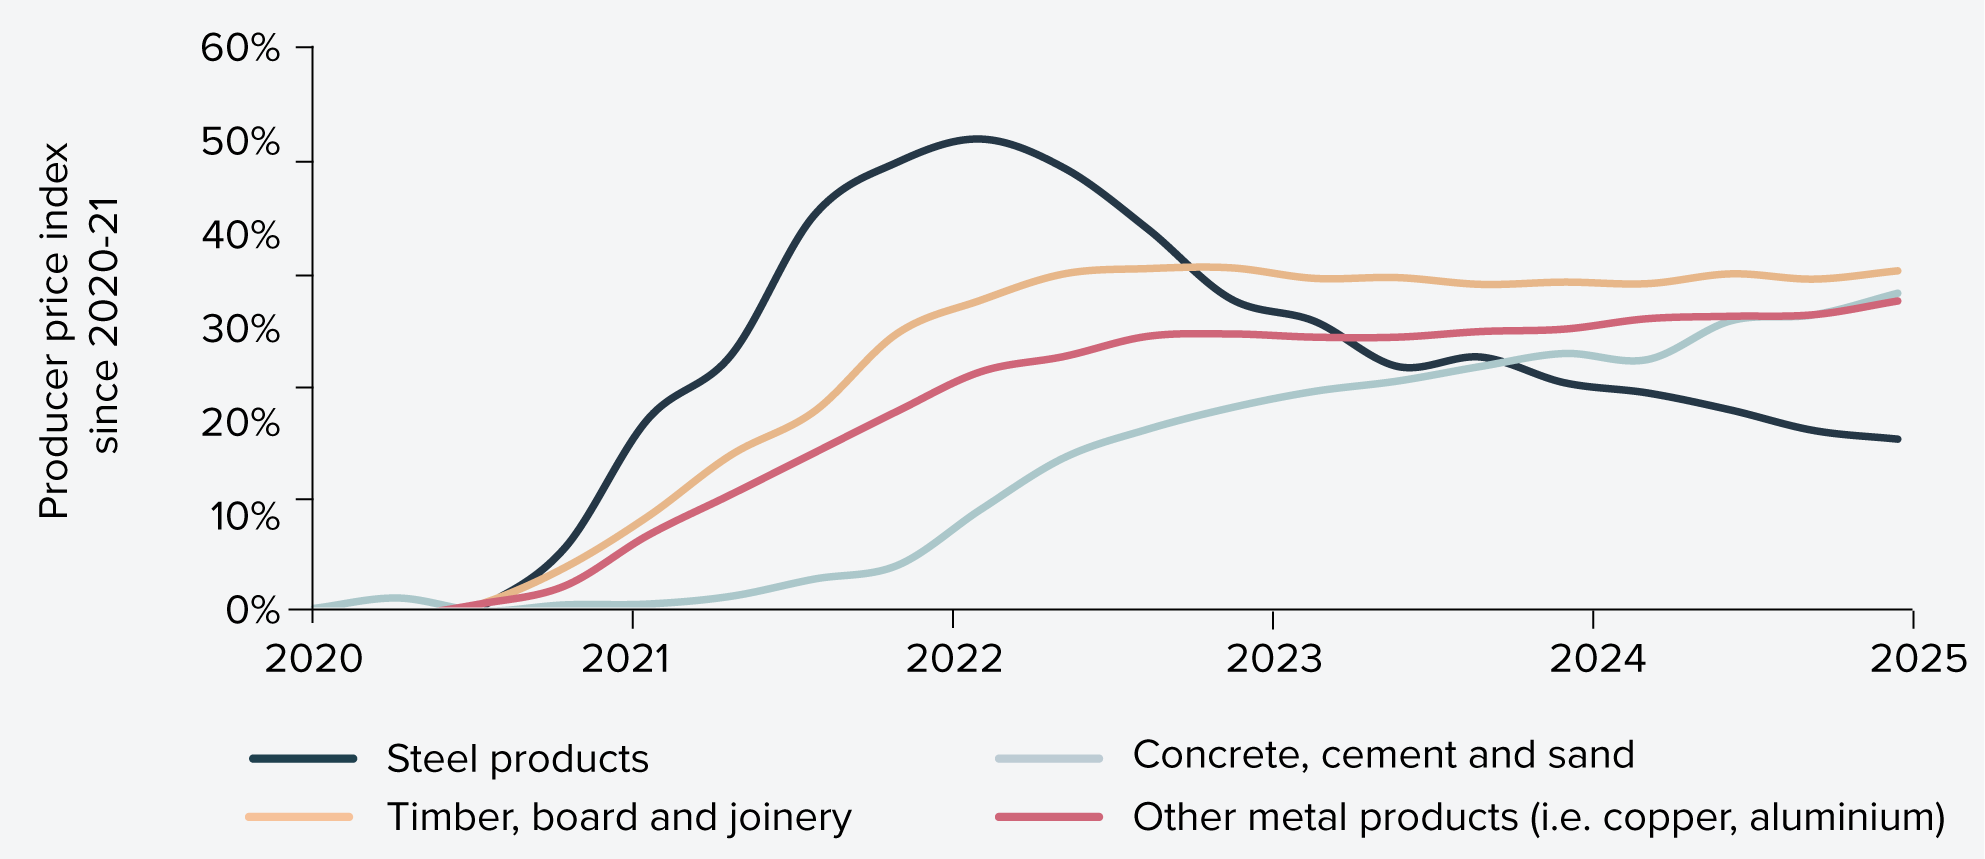
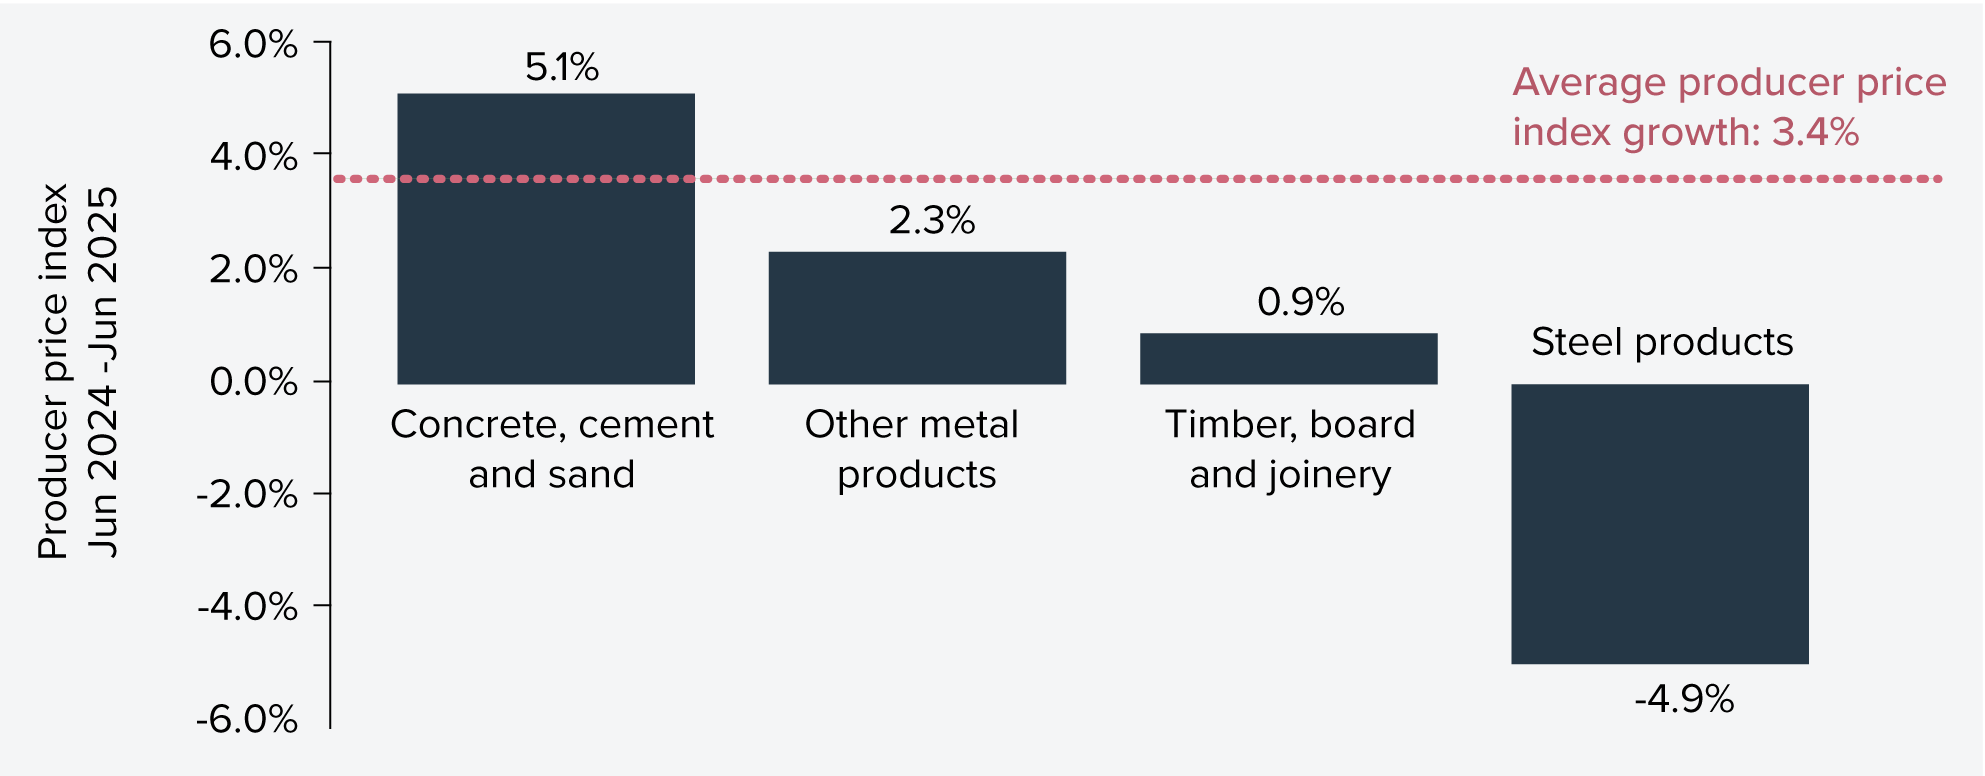
- Prices of key construction materials rose modestly in line with inflation (to June 2025), with the only exception being steel prices which fell by 4.9% over the same period, continuing a downward trend since 2022.
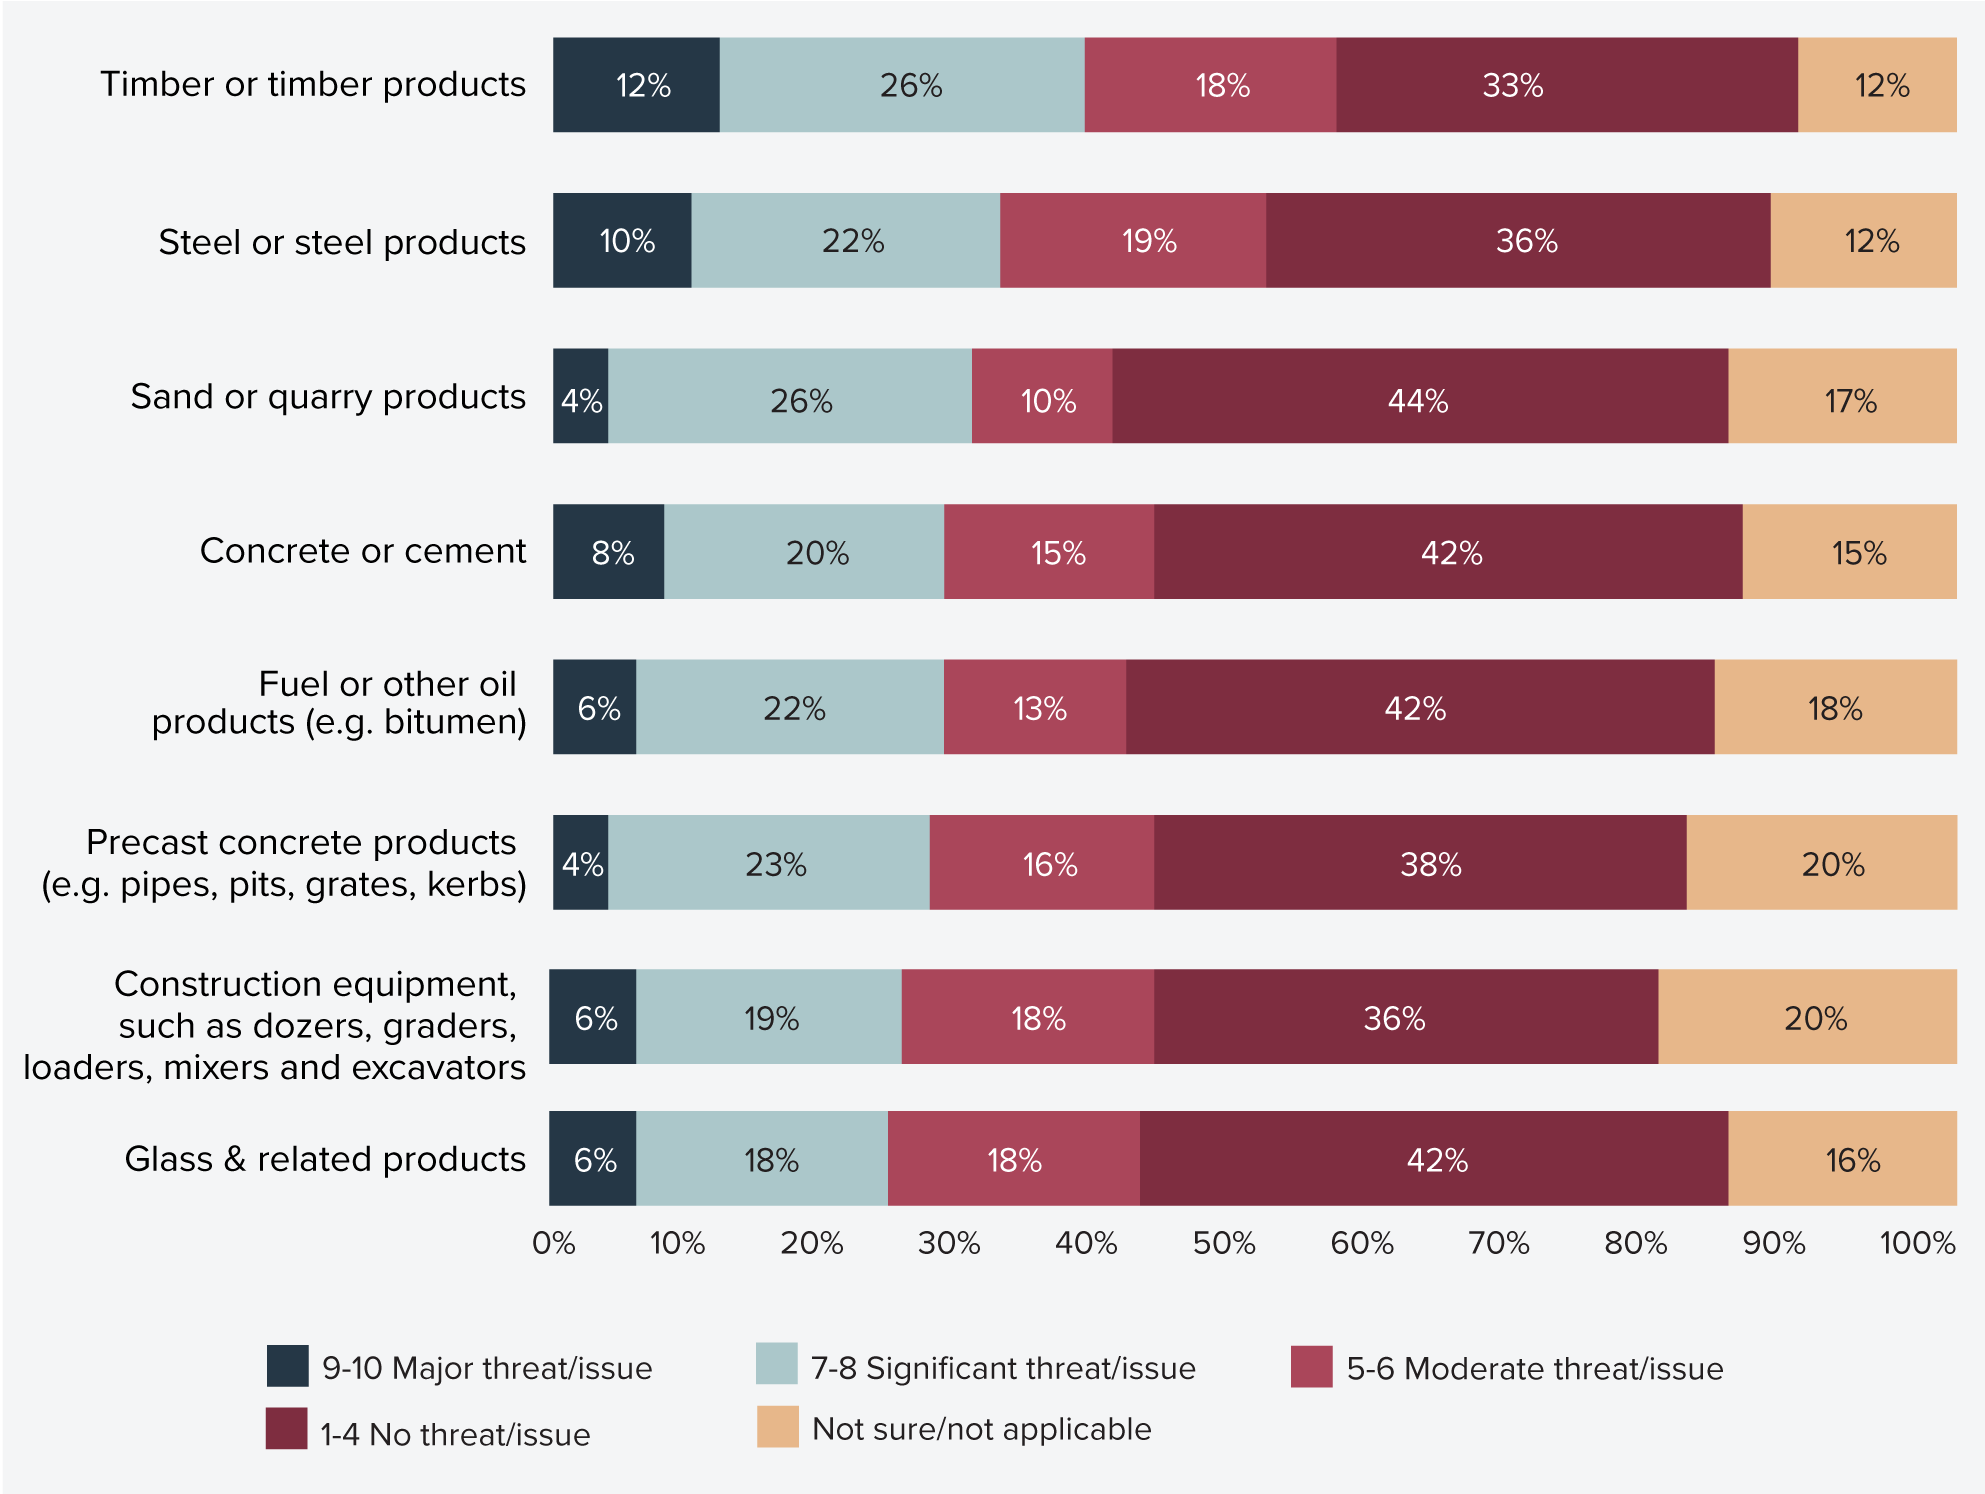
- Industry identifies steel and steel products, along with concrete and cement, as the highest-risk materials for delivering transport and utility projects — around one-third of surveyed respondents rated these as major or significant threats to successful delivery.
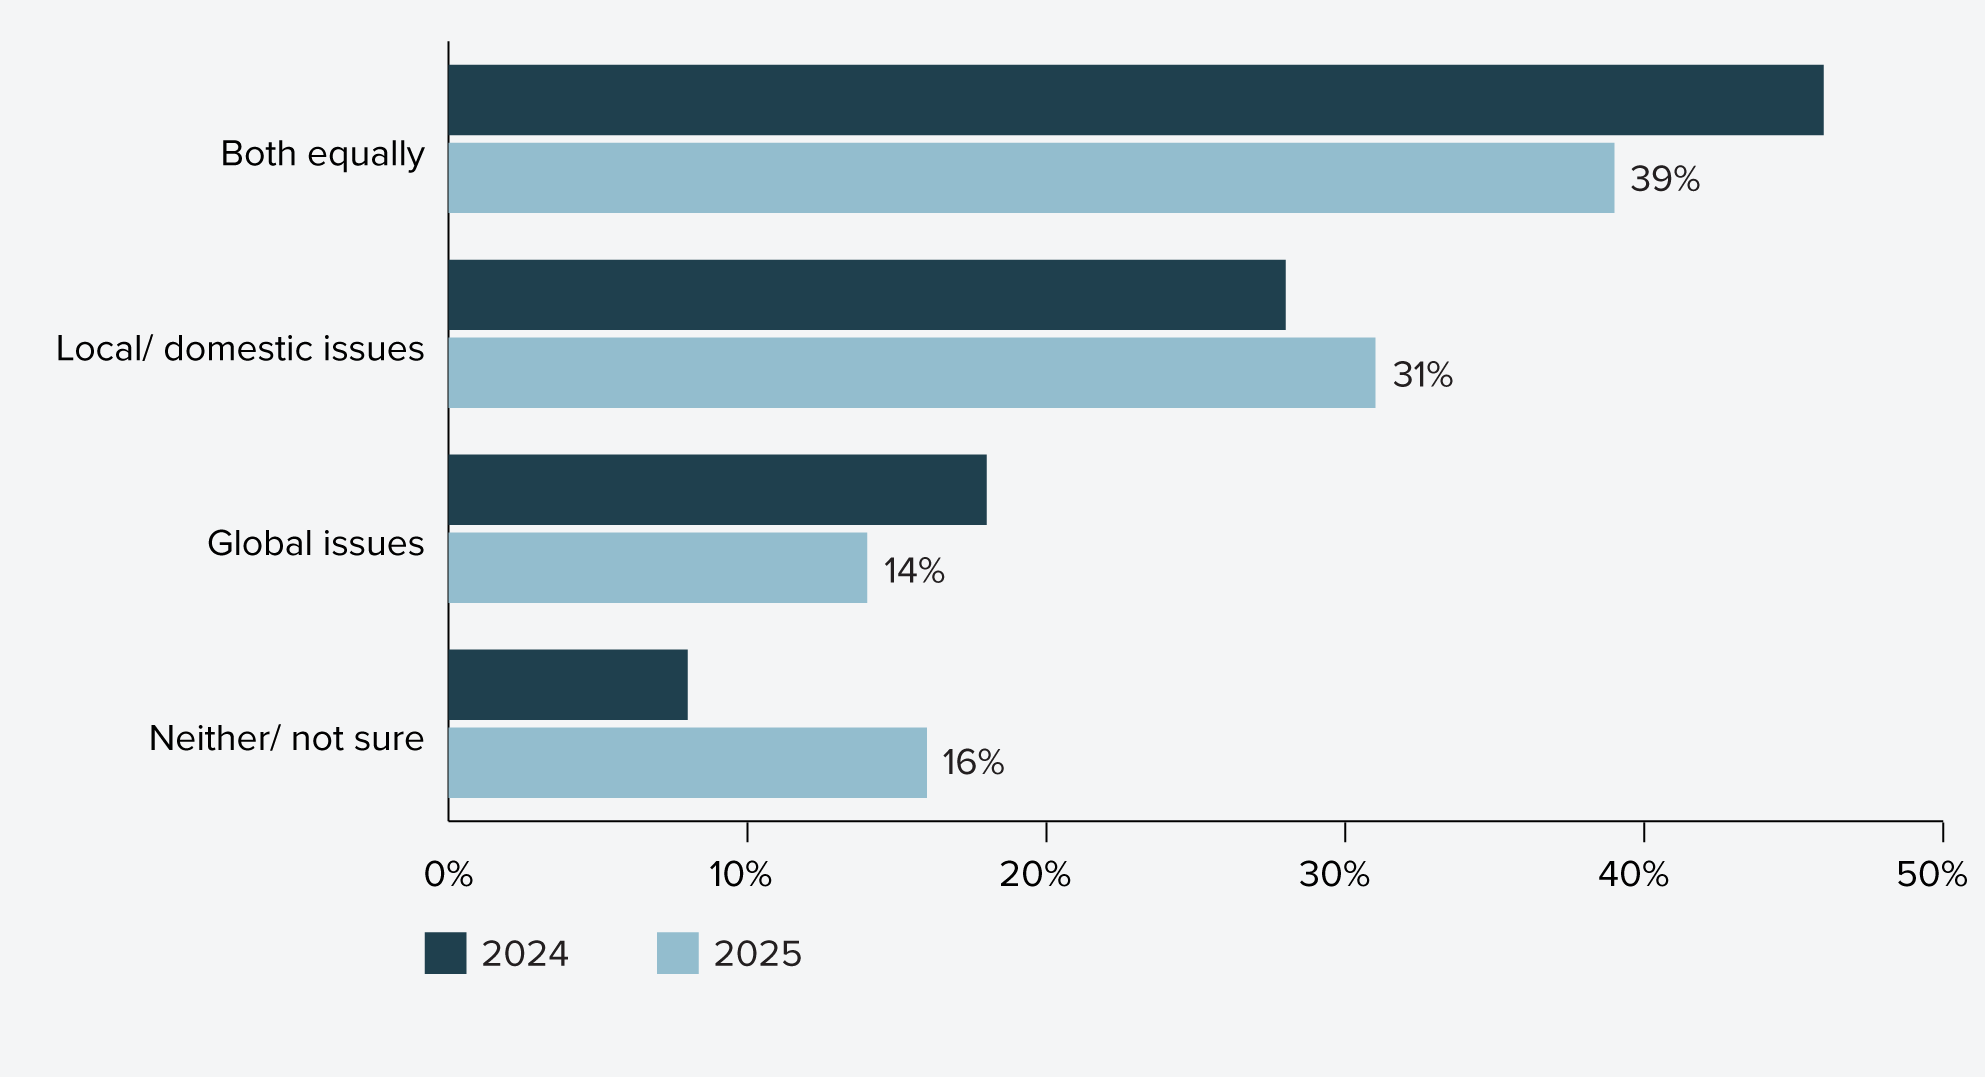
- Supply chain risks are now more balanced: 39% of organisations see domestic and international issues as equal risks, 31% view domestic issues as most problematic, and 14% global issues; only 12% rate international disruptions as a major threat (down from 16% in 2024).
- Domestic steel fabrication is critical but under pressure: the sector (42,000 jobs, $18.7 billion sales) supplies essential infrastructure components but faces rising insolvency and import competition.
- Quality concerns over imports and inconsistent enforcement of Australian Standards persist. Governments are investing in green metals and key assets for steel manufacturing capacity (e.g., Whyalla Steelworks, Port Kembla upgrades) to maintain sovereign capability. More could be done to shore up domestic fabrication capacity further down the supply chain.
- Lower emissions materials are critical for reducing embodied infrastructure emissions but are underutilised: while governments have funded initiatives and research programs to promote low-carbon and recycled alternatives, uptake remains slow due to prescriptive specifications, weak demand signals, and unclear commercialisation pathways. Stronger procurement levers, performance-based standards, and capability building would help to scale adoption and meet net zero targets.
SECTION 2: Non-labour supply
The price of key construction materials grew slightly and in line with inflation
Figure 9 shows that over the 12 months to June 2025, the price of concrete, cement and sand products rose by 5.1%, the price of timber, board and joinery products rose by 0.9% and metals (such as copper and aluminum) grew by 2.3%. This broadly aligns with the Producer Price Index’s growth of 3.4% over the last 12 months to June 2025 and reinforces a post-COVID trend where materials prices have risen higher than wages, which increased 3.2% for the construction sector in the same 12 months.
The price of steel and steel products however continues to drop
Unlike other key construction materials, the price growth of steel and steel products has dropped from a high in 2022 — a trend that has continued this year with a further 4.9% drop over the 12 months to June 2025. See Figure 9.
Figure 9: Increase in price in selected materials – past 12 months and trend since 2020-21
Source: Australian Bureau of Statistics (2025)11
Industry report steel and concrete supply as the top risks to delivery of transport and utilities projects
Response from Infrastructure Australia’s annual Industry Confidence Survey indicates that the supply of most key materials continues to impact project delivery. Figure 10 shows that approximately one in three organisations highlighted supply of timber and timber products (38%), steel or steel products (32%) and concrete or cement (28%) as a major or significant threat to successful delivery. This reflects findings from last year’s survey, highlighting the continued importance of these supplies for successful project delivery.
Figure 10: Supply chain risk factors to successful delivery of infrastructure projects in the last 12 months (%)
Source: Infrastructure Australia Industry Confidence Survey (2025)
Drilling further down into survey responses, indicative top materials risks by sector are as follows:
- Transport projects: supply of steel or steel products pose the highest risk, followed by construction equipment and sand, then quarry products.
- Utilities projects: supply of construction equipment, followed by steel or steel products, then concrete or cement.
- Residential housing projects: supply of steel or steel products, followed by timber or timber products, then concrete or cement.
Industry expects non-labour costs to continue increasing
Six in 10 surveyed organisations observe non-labour input costs for infrastructure projects have increased over the last 12 months (68%, including 25% who have seen these ‘increase a lot’).
Almost half (48%) believe prices have been accelerating over 2025 and more than a third (36%) think prices have not yet peaked. These results are similar to last years’ findings, indicating the outlook on materials supply prices has remained steady over the last 12 months.
Supply chain risks are more subdued, and caused by both international and domestic issues
Figure 11 shows that businesses generally viewed both international and domestic supply issues as posing equal risks to project delivery, as voted by 39% of surveyed organisations. 31% of organisations believe local or domestic supply chain issues are most problematic while 14% believe global issues are more problematic. Compared to last year’s survey findings, domestic/local issues appear slightly more pronounced (31% vs 28%).
Overall, the market reports less international supply chain issues than last year. Of surveyed organisations, 14% believe international supply chain disruptions, shortages or delays are a major threat to successful project delivery, dropping from 16% in 2024.
Figure 11: Comparison of the source of supply chain issues reported in 2024 and 2025
Source: Infrastructure Australia Industry Confidence Survey (2025)
SECTION 2 SPOTLIGHT: Domestic steel fabrication capacity
Fabricated steel products are crucial inputs in construction
Steel is a critical input material needed to deliver Australia’s infrastructure pipeline. Steel fabrication is essential in construction products such as foundations, piling, columns, beams, and girders. Areas of specialisation include wind turbine towers, transmission towers, equipment for mining, armoured vehicles for Defence, naval and domestic ship building, and rolling stock.12
An estimated 26.6 million tonnes of structural steel elements is needed to deliver Australia’s construction pipeline over the five years 2024–25 to 2028–29, of which public projects on the Major Public Infrastructure Pipeline will need 3.6 million tonnes. As the estimated national steel fabrication capacity is approximately 1.4 million tonnes per annum,13 meeting this demand will require a combination of locally produced and imported steel.
The volume of imports has grown rapidly in recent years, in the face of demand and cost challenges, but quality is difficult to ascertain
Fabricated steel imports have risen sharply, with 2024 volumes nearly 50% higher than the yearly average between 2016-2021 (Australian Steel Institute, 2024). Australia’s steel fabricators claim these imports are often priced at 15-50% below domestically produced products.
It is difficult however to ascertain whether imported steel products are fabricated to the same quality and safety standards as locally made products (AS/NZS 3678, AS/NZS 5131). Lack of traceability and certification makes it difficult to track material compositions, manufacturing processes and quality control procedures, which increases the risk of using substandard products.
Within Australia, most government procurement specifications reference compliance to relevant Australian Standards (such as AS/NZS 5131 – Structural steel fabrication and erection, AS/NZS 3679 – Hot-rolled steel sections; and AS/NZS 1163 – Cold-formed structural hollow sections), however compliance is not mandated, and enforcement on infrastructure projects varies across the country.
At the federal level, Australian Government procurement rules require that for construction projects above $7.5 million, tender responses must demonstrate capability to meet Australian Standards. Agencies must make reasonable inquiries to confirm compliance.14
Ensuring equal quality requirements for both imported and locally produced steel is essential to maintain viability of local suppliers and safeguard infrastructure delivery
Australia’s structural steel fabrication sector comprises largely of small and medium size enterprises (SMEs), many of which are multi-generational family-owned businesses and employed over 42,000 people in 2022-23.15
Domestic fabricators claim they are under significant pressure from low-cost imports. A national survey by the Australian Steel Institute (2024) indicates that 80% of Australian fabricators are operating below the break-even capacity benchmark. The insolvency rate for fabricated metal product manufacturing has been growing since the winding back of Covid-19 temporary relief measures in early 2021, surpassing pre-Covid levels in 2023.16
While sourcing steel products offshore can help alleviate demand and cost pressures in construction, it is important to maintain an even playing field between imported and locally produced products. A strong local fabrication base ensures continuity for critical infrastructure projects, reduces dependency on international markets, and supports sovereign capability for sectors such as Defence and energy. It mitigates risk from potential geopolitical tensions, trade disruptions, and price volatility.
With imports rising rapidly in recent years, governments could help safeguard infrastructure delivery by requiring that all imported fabricated steel products used on major projects meet Australian quality standards. This would ensure an even playing field for domestic producers to compete with overseas suppliers.
SECTION 2 SPOTLIGHT: Lower emissions materials
Building materials are a significant source of emissions. Infrastructure Australia’s Embodied Carbon Projections report estimates that in 2022-23, upfront embodied emissions from Australia’s buildings and infrastructure sector accounted for 7% of national emissions, with the majority arising from the manufacture of building materials.17
Promising low carbon alternatives already exist across the sector, such as concrete with lower carbon cementitious alternatives and steel products manufactured using electric arc furnace technology. Alongside these innovations, recycled materials present another pathway to emissions reduction by reducing demand for energy intensive primary processing of conventional materials, improving resource efficiency and reducing waste.
Reducing embodied emissions in transport infrastructure is an Australian Government priority, as outlined in the Transport and Infrastructure Net Zero Roadmap and Action Plan (Transport Sector Plan), released in September 2025. The Plan notes that shifting to lower emissions construction materials will not only be critical to achieving this priority but also presents a major opportunity to strengthen domestic capability and position Australian industry to compete in global markets in this space. It considers opportunities to reduce emissions through optimised design and procurement, including the use of recycled materials.
Governments have committed to using lower emissions materials
Governments recognise the opportunity to incorporate lower emissions materials in infrastructure builds. In addition to whole-of-government sustainable procurement policies, several jurisdictions have introduced infrastructure-specific policies that embed environmental and circular economy objectives directly into project planning and delivery. Examples include Victoria’s Recycled First Policy, Western Australia’s Transport Portfolio Sustainable Infrastructure Policy and New South Wales’ Decarbonising Infrastructure Delivery Policy. These policies aim to decarbonise infrastructure, drive demand for recycled and low carbon materials, and embed sustainability considerations into procurement and investment decisions.
At the federal level, all governments have committed to optimise recycled content in transport infrastructure as part of their procurement practices under the Federation Funding Agreement Schedule (FFAS) on Land Transport Infrastructure Projects. Under the FFAS, jurisdictions are required in 2025, for the first time, to report on their uptake of recycled content in infrastructure projects or establish annual reporting against recycled content uptake.18
This marks a significant first step in collecting data and setting comparable, if not consistent, baselines on the uptake of recycled content across the country.
The Australian Government has also invested in applied research initiatives such as the SmartCrete Cooperative Research Centre ($21 million over seven years from 2020) to co-fund and coordinate collaborative research to improve the durability, performance, and environmental footprint of concrete used in infrastructure.19,20
Other funding initiatives highlighted in the Australian Government’s Transport and Infrastructure Net Zero Roadmap and Action Plan include $59.1 million awarded via the Australian Renewable Energy Agency (ARENA) to support low emissions steel, iron and renewable hydrogen research and development, $750 million to support green metal projects through the Future Made in Australia Innovation Fund and low or no cost loans from the Clean Energy Finance Corporation for low carbon concrete initiatives in housing and industrial developments.21
Industry faces various barriers to scaling up supply of lower emissions materials for infrastructure construction
Despite efforts by Australian, state and territory governments, the current uptake of low emissions and recycled materials remains low. Structural barriers and inconsistent demand signals continue to constrain the industry’s ability to scale production and investment.22
SmartCrete for example, has called out poor commercial adoption and uptake of research as a critical barrier to achieving its goals. It has noted that while technical solutions for low-carbon concrete exist, procurement and market practices remain the biggest impediment. The current procurement model — focused on lowest cost and short-term performance on project-to-project basis — discourages innovation and uptake of sustainable materials. This results in a “valley of death” where research outcomes fail to transition into large-scale commercial use.23
A key barrier is the persistence of prescriptive project requirements, which tend to specify material types and inputs rather than outcomes. This approach prioritises established methods and materials but often prevents the adoption of proven low-carbon alternatives. Shifting towards performance-based specifications would allow suppliers greater flexibility to innovate, while still meeting quality and safety outcomes.
Industry also reports uncertainty around the pathways from research to commercial application. Significant investment can go into development and testing new materials, only for them to be excluded by unclear or inconsistent specifications. Developing transparent and nationally consistent processes for testing, approval and commercialisation would provide certainty, reduce risk and encourage suppliers to invest more confidently in new materials.
Opportunity to upskill and change culture to embrace new materials
The rapid development of various types of lower emission materials presents a challenge, but also an upskilling opportunity for industry and government proponents. On the government side, decision makers and advisors responsible for project design, procurement and market engagement might not have the most up-to-date knowledge to help them weigh up the benefits and risks of adopting low carbon materials, set the most appropriate technical specifications, or access supply availability for proposed projects.
Building capability within project teams on both sides — through training, embedding carbon expertise and providing clearer guidance on the adoption of new and emerging new low emissions materials — can ensure that materials specifications are appropriately set and that projects optimise the use of innovative materials without compromising quality or safety. The Australian Government, under Priority Action 5 of the Transport Sector Plan, is supporting decarbonisation capability in the private and public sectors. Through the Infrastructure Transport Ministers’ Meeting, it is exploring an infrastructure capability building program and a central knowledge hub, which could provide carbon literacy training, showcase low-emissions innovations and share practical resources for low-carbon solutions.24
SECTION 3 SUMMARY: Workforce and skills
Expand labour supply – future opportunities
Governments could explore opportunities to coordinate and align emerging training programs across jurisdictions to accelerate the development of priority construction workforce skills in digital technologies, modern methods of construction, and decarbonisation.
This could include sharing lessons learned, promoting standard approaches to course design delivery and facilitating cross-jurisdiction recognition of prior learning for unaccredited training to improve workforce mobility.
Summary
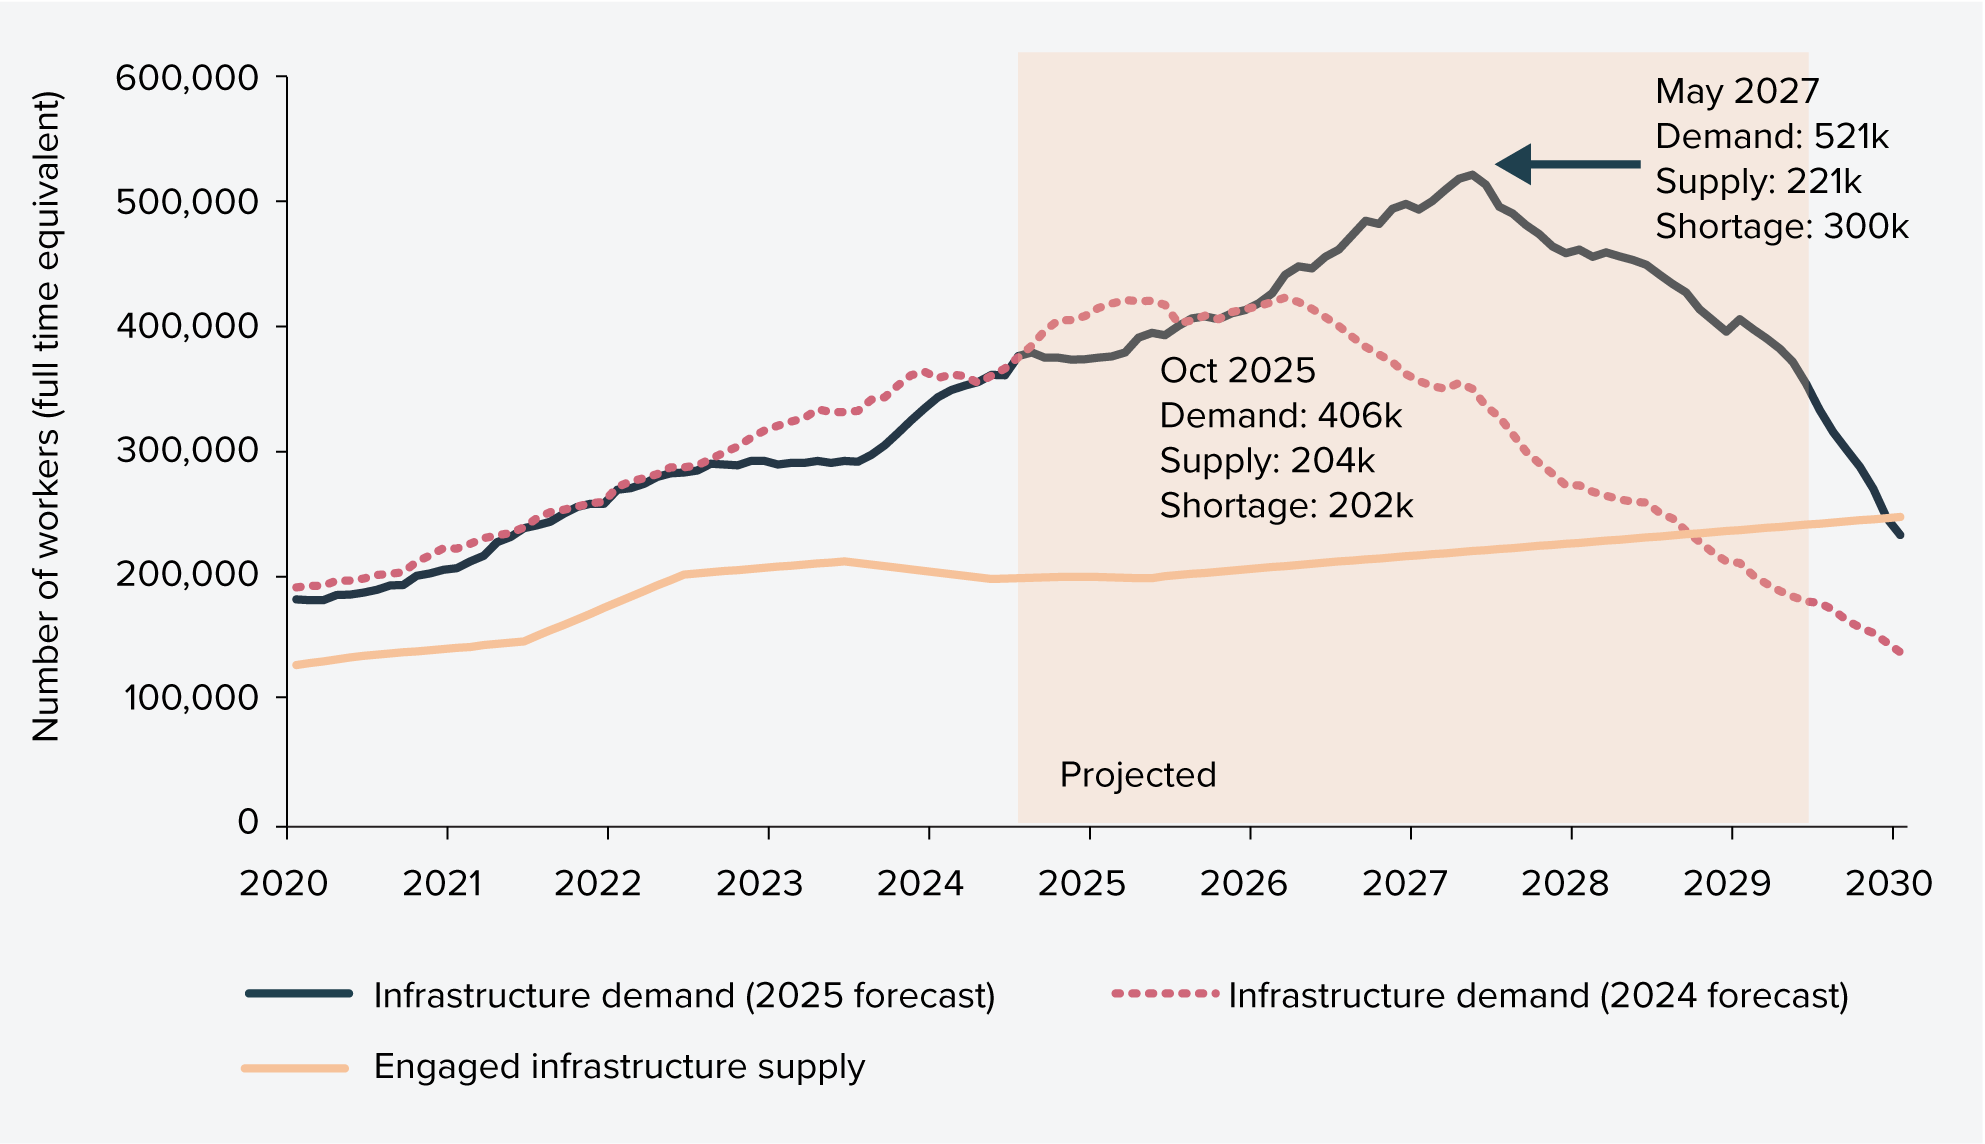
- As at October 2025, Australia’s current infrastructure workforce stands at 204,000 workers.
- There is an estimated shortage of 141,000 workers, which could reach a peak of 300,000 by 2027.
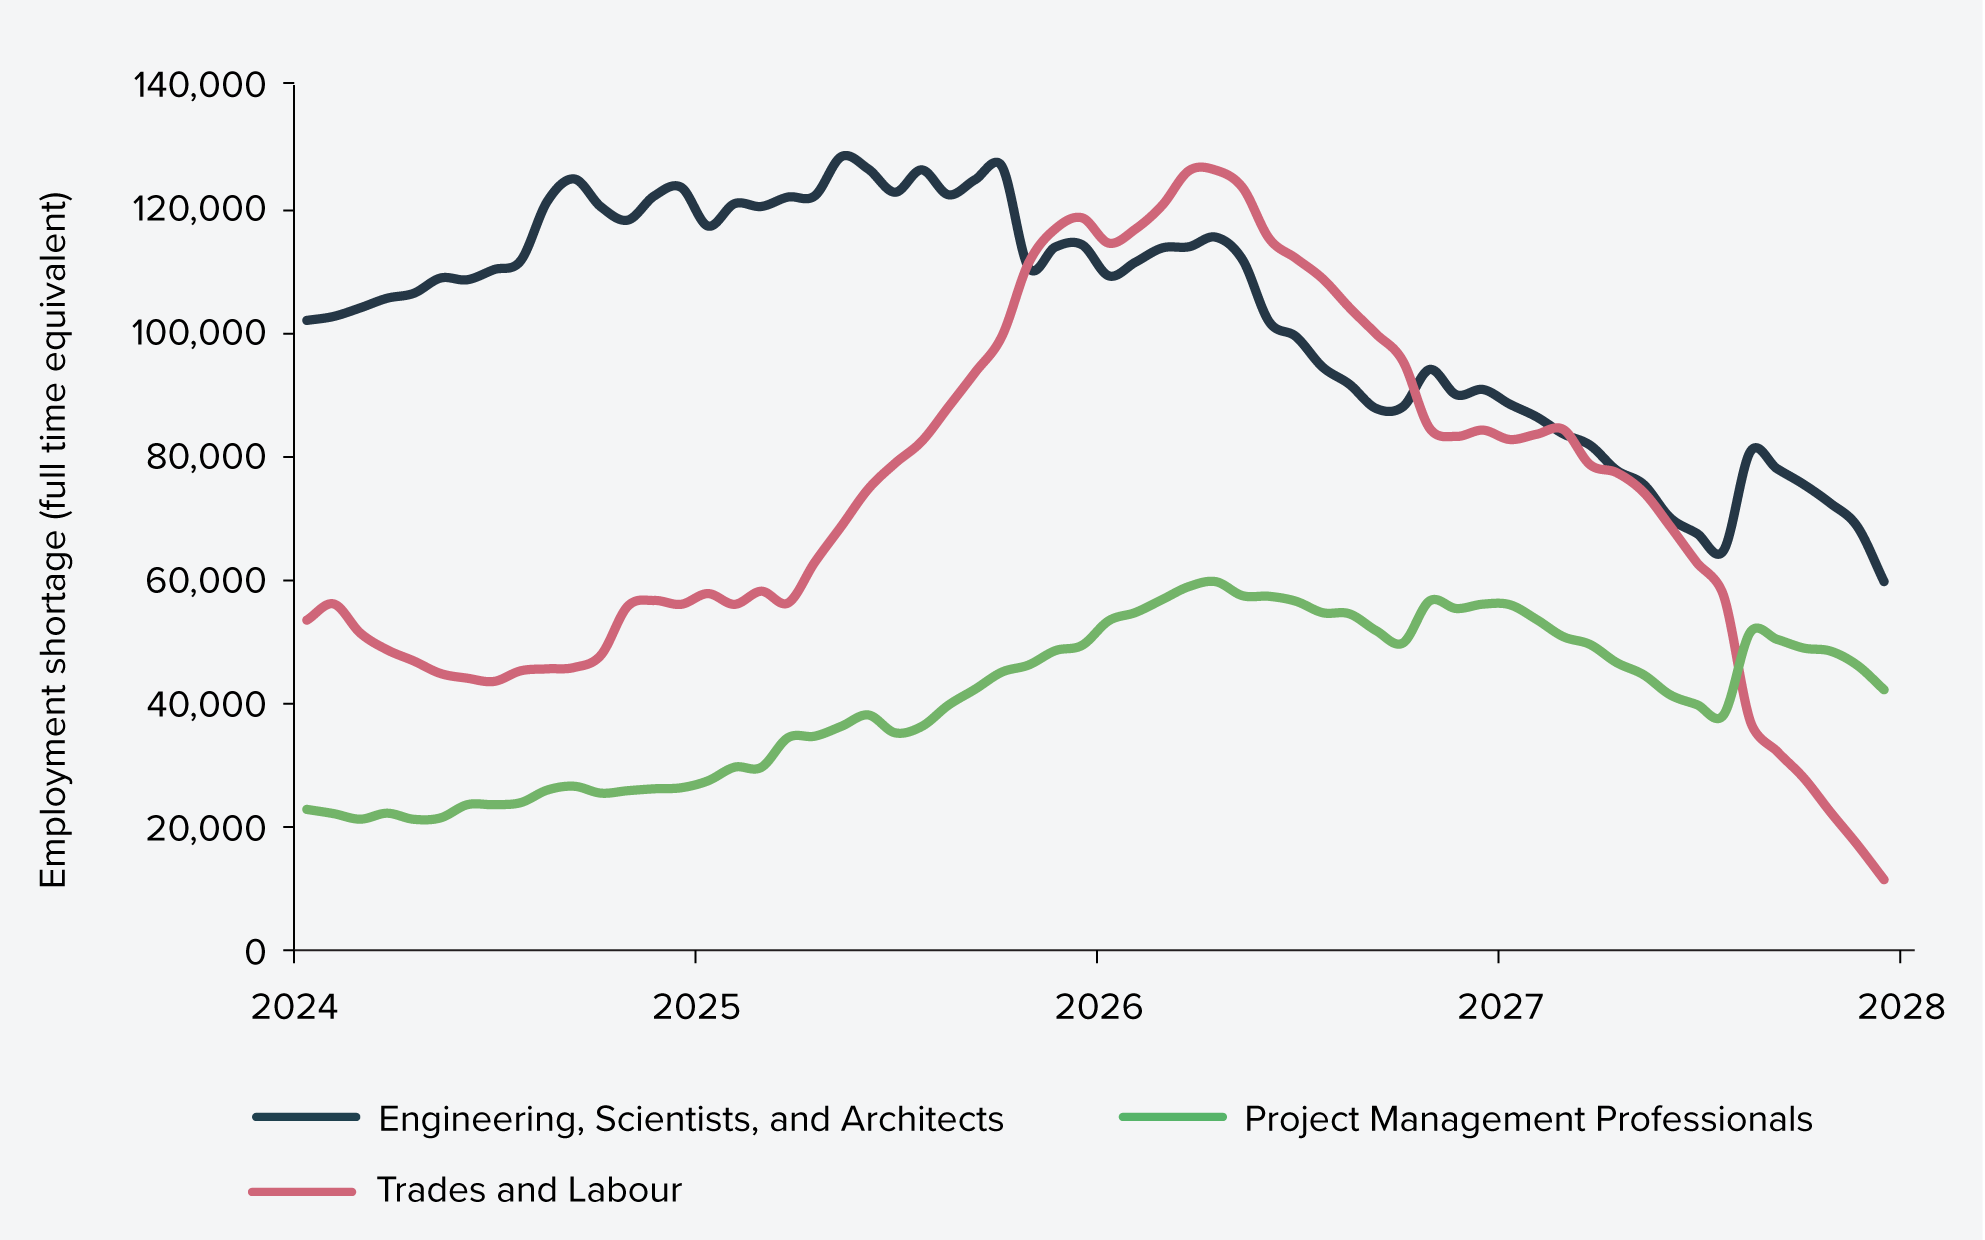
- By occupational groups, shortages for both Architects and Scientists as well as Trades Workers and Labourers will peak at approximately 126,000, with the latter rising quickly.
- Labour continues to pose a substantial delivery risk with 63% of firms surveyed this year citing labour cost and 59% citing labour and skills shortages as a substantial threat to delivery.
- Professional roles such as engineers and designers are stretched across new growth sectors – energy, water, and commercial sectors while demand for transport work keeps at pace.
- Energy infrastructure pipeline uncertainty is prompting companies to adopt a cautious ‘wait and see’ approach to workforce and skills investment. This means rather than committing to long-term training or recruitment, many are relying on redeploying workers from adjacent sectors to meet short-term demand. However, there is ambiguity on the level of actual transferability of skills between these sectors.
- Australia’s experience broadly reflects global trends, which show a construction workforce struggling with persistent labour shortages and at the same time being reshaped by two key drivers - rapid digitalisation and decarbonisation.
- 66% of the sector has invested in workforce upskilling in the past 12 months, with engineers and designers investing the most in upskilling (85%).
- Industry is aware of the net zero imperative, but progress is slow – one in five companies have set organisational commitments to reducing carbon.
- Low confidence and lack of guidance might explain this slow progress to embedding net zero - 40% of firms feel they lack access to emissions-reduction training.
- Industry, governments, and education and training sectors recognise and are acting on the urgent need to upskill the construction workforce. There is an opportunity to leverage lessons already learned, align and collaborate across jurisdictions to lift workforce capability in new technology and decarbonisation skills development and delivery.
SECTION 3: Infrastructure workforce supply and shortage update
The infrastructure workforce stands at 204,000, with demand growth outstripping supply
As of October 2025, there are 204,000 workers engaged in infrastructure across the nation. By occupation groups, this comprises approximately:
- 62% Trades Workers and Labourers
- 26% Engineers, Architects and Scientists
- 12% Project Management Professionals
Figure 12 shows the latest projection of demand versus supply over the five-year period. Compared to last year’s projections, peak workforce demand has increased - rising from 417,000 to 521,000 - and has shifted out one year from mid-2026 to mid-2027. This trend is consistent with observations made in previous years and is likely reflective of planned expenditure being pushed back as the market struggles to meet overly ambitious delivery targets.
Figure 12: Demand, supply and shortage of infrastructure workers (2024-25 to 2028-29)
Labour shortages could rise to 300,000 workers by 2027
We estimate a shortage of 141,000 workers on public infrastructure works as of October 2025. This is 56,000 less than was estimated in last year’s Infrastructure Market Capacity report, and reflects demand being pushed out to the later years. This reduced shortage delivers a temporary reprieve before a new shortage peak of more than 300,000 workers in mid-2027. This increased shortage of workers is going to be driven by the rise in demand for privately funded renewable energy projects, see Section 1 Understanding Demand for more information on the energy pipeline.
Figure 13 shows that shortages for Engineers, Architects and Scientists roles will peak at 126,000 in late 2026 before gradually declining over the outer years to 2028-29. Meanwhile, shortages for Trades Workers and Labourers peaks at 126,000 by mid-2027. There will be a sustained demand for Project Management Professionals, which is also projected to peak in mid-2027 at around 59,000.
Figure 13: Workforce shortage by occupational groups (2024-25 to 2028-29)
Regional shortages will increase four-fold over the next two years, driven by energy and utilities projects
Figure 14 presents a national comparison of shortages across capital cities and in regional areas (outside the Greater Capital City Statistical Areas as defined by the Australian Bureau of Statistics).
Shortages in metro locations are projected to rise modestly from 131,700 in October 2025 and peak at 148,000 in 2026. Regional locations, however, will experience a much steeper increase, with the workforce shortage growing from 38,200 in October 2025 to a peak of 181,000 in 2027.
Figure 14: Workforce shortage by occupation group, capital-city areas versus regional areas (2024-25 to 2028-29)
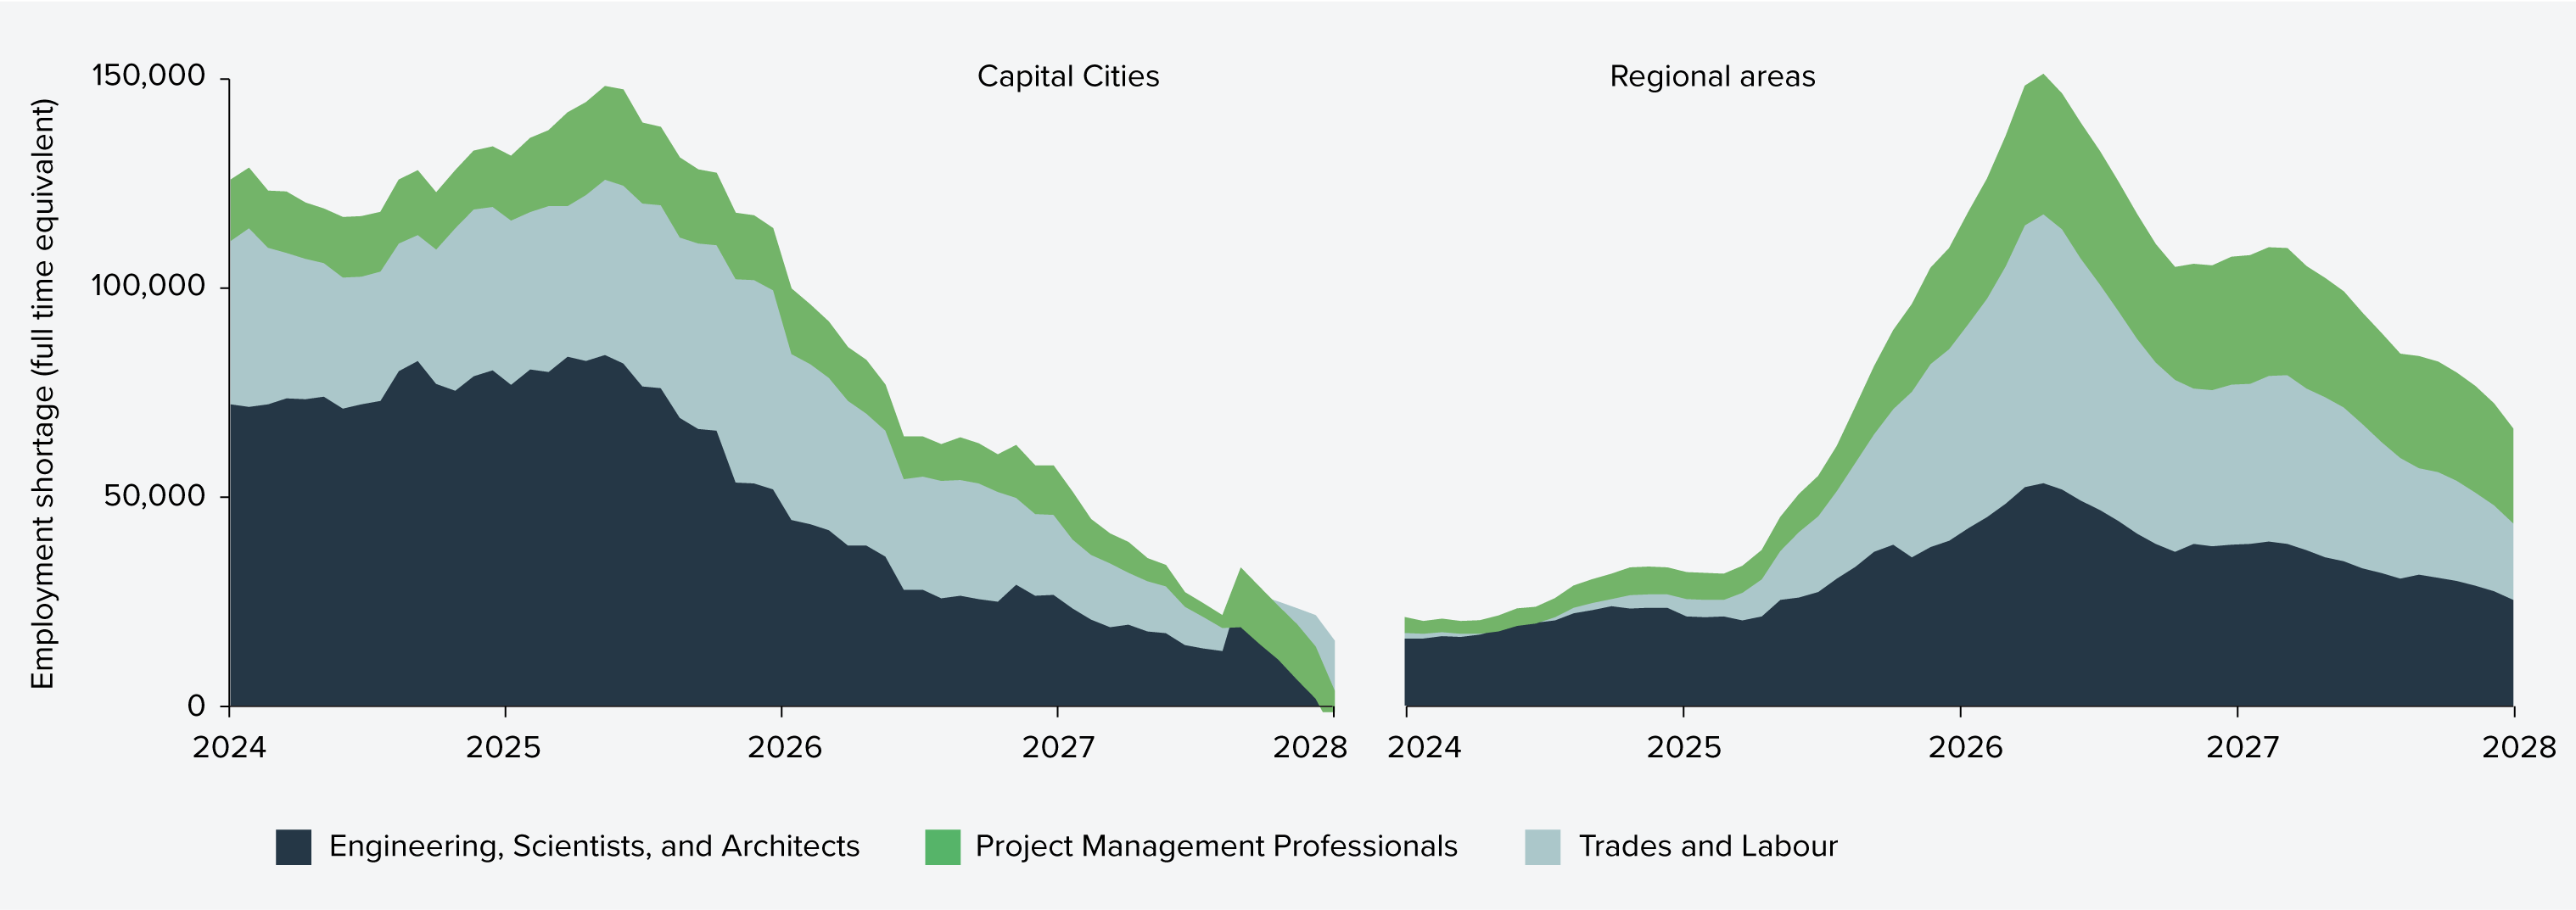
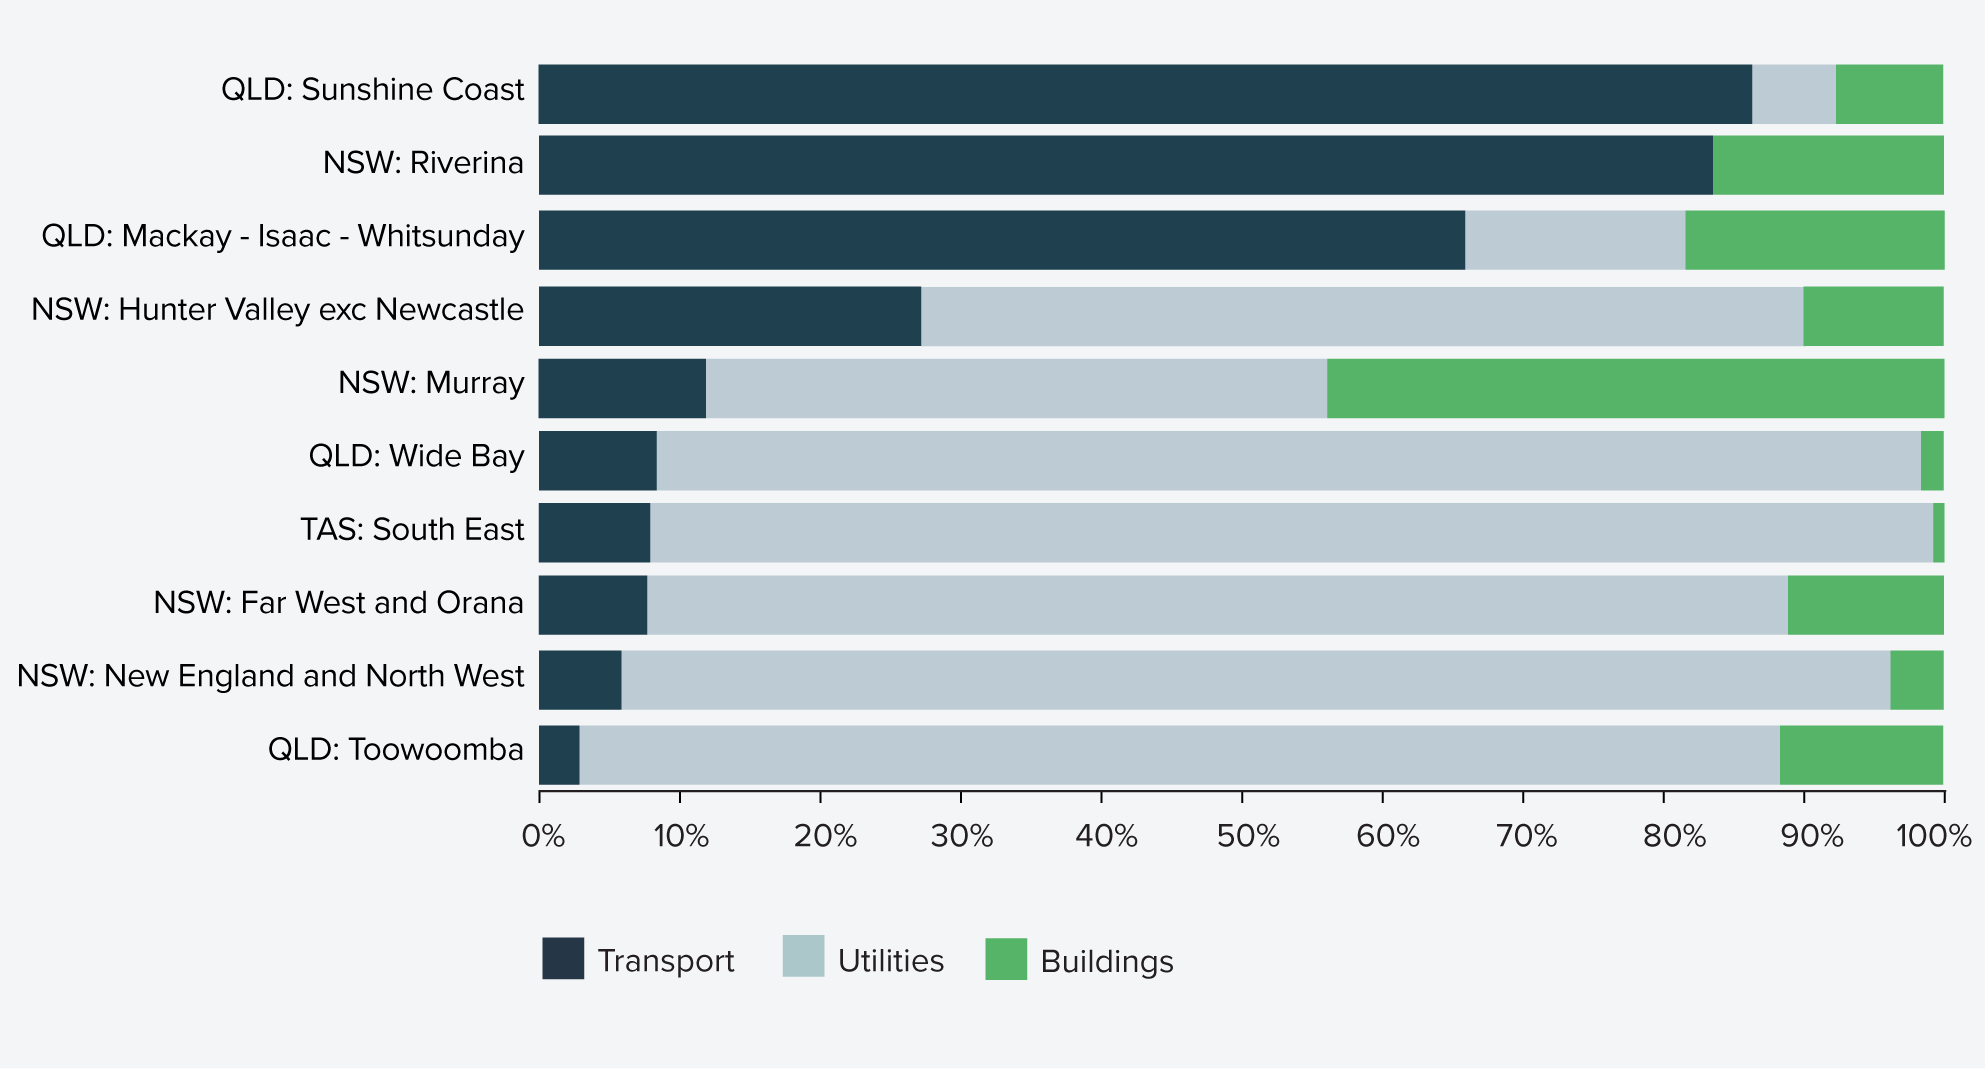
Figure 15 shows 10 hotspot regions with forecast demand over the next four years (2025-2026 to 2028-29) doubling from the demand in the four years prior (2021-2022 to 2024-24) across:
- New South Wales: New England and North West, Far West and Orana, Murray, Hunter Valley excluding Newcastle, Riverina
- Queensland: Sunshine Coast, Wide Bay, Mackay-Isaac-Whitsunday, Toowoomba
- Tasmania: South East
Figure 15: Increase in public investment from previous 4-years (2021-2022 to 2024-25) to next four years (2025-2026 to 2028-29), by region

Projected demand across the 10 regional hotspots is heavily dominated by the utilities sector, which represents approximately 60% of total demand - underscoring its significance as the driving force behind regional workforce need, as shown in Figure 16.
Figure 16: Projected demand breakdown by sector and region (2025-26 to 2028-29)
CASE STUDY
Filling in the knowledge gap on workforce mobility between construction sectors
BuildSkills Australia, the Jobs and Skills Council for the build environment is leading a study, supported by Jobs and Skills Australia and the Australian Bureau of Statistics, to understand and enhance worker mobility into and out of the residential construction sector.
The study focuses on core residential construction occupations - those most critical to housing delivery and most vulnerable to capacity constraints during demand surges (e.g., under the National Housing Accord target of 1.2 million homes).
Scope of the study
The study will map the actual and potential labour flows between residential, infrastructure, non-residential construction, and other sectors. It will identify:
- Where additional workers can be sourced quickly during demand peaks.
- What barriers prevent mobility (e.g., licensing, cultural differences, employment models).
- What policy levers can reduce friction and enable faster, more efficient workforce redeployment.
Expected impacts
Filling in critical knowledge gaps on actual and potential worker movements between construction an adjacency sectors, findings of the research will:
- Unlock latent labour supply by making it easier for workers in infrastructure and non-residential sectors to move into housing projects when needed.
- Boost workforce resilience by reducing dependency on new entrants and improving utilisation of existing skilled labour.
- Support faster delivery of housing targets under the National Housing Accord by enabling short-to-medium-term workforce scaling without compromising quality or safety.
This research is expected to be released in 2026.
As the first study of its kind examining worker mobility across construction subsectors, this approach could be extended to explore workforce movement within adjacent infrastructure sectors such as energy, transport, and water.
The workforce is being shaped by the digital and energy transition
The World Economic Forum’s Future of Jobs report finds that 86% of firms expect AI and informationprocessing will transform their business by 2030, and that this will both create new roles and displace existing ones.25
The report projects a 15% reduction in tasks performed solely by humans by 2030, with 82% of that shift driven by automation and 19% by human–machine collaboration. For construction, this means routine, repetitive tasks (e.g., material handling, basic measurements) will increasingly be supported by machines, robotics, and digital tools, while humans focus on complex, adaptive, and safety-critical tasks.
The construction industry should expect to see increased “bifurcation” of its workforce, with tech-enabled harnessing digital tools such as BIM, digital twins, and AI, while still requiring large numbers of on-site workers. Building construction workers such as labourers and trades workers (along with other frontline workers) are projected to have the highest absolute job growth globally over the next five years, reinforcing their critical role in economic recovery and infrastructure delivery.
Global construction industry hiring activity in 2024 reinforces the drive towards digital transformation and renewables. Key global trends across new job postings in the construction industry in 2024 include:26
- 7% of job postings are for tech roles—more than job postings in transport and logistics (3%), metals and mining (3%), and similar to automotive sectors (8%). See Figure 18.
- 21% rise in job postings for AI skills, with a focus on GenAI and Agentic AI roles and boosted demand for expertise in ChatGPT and Copilot.
- Demand growth for skills in key areas: 3D modelling, drone operation, and BIMs; big data and cybersecurity; asset management and modular construction.
- Leading built environment firms (such as AECOM and JLL) scaled recruitment tied to renewables, water, datacentre development, and digital transformation.
Figure 18: Percentage of technology (IT) job postings by selected industry sector (2024)
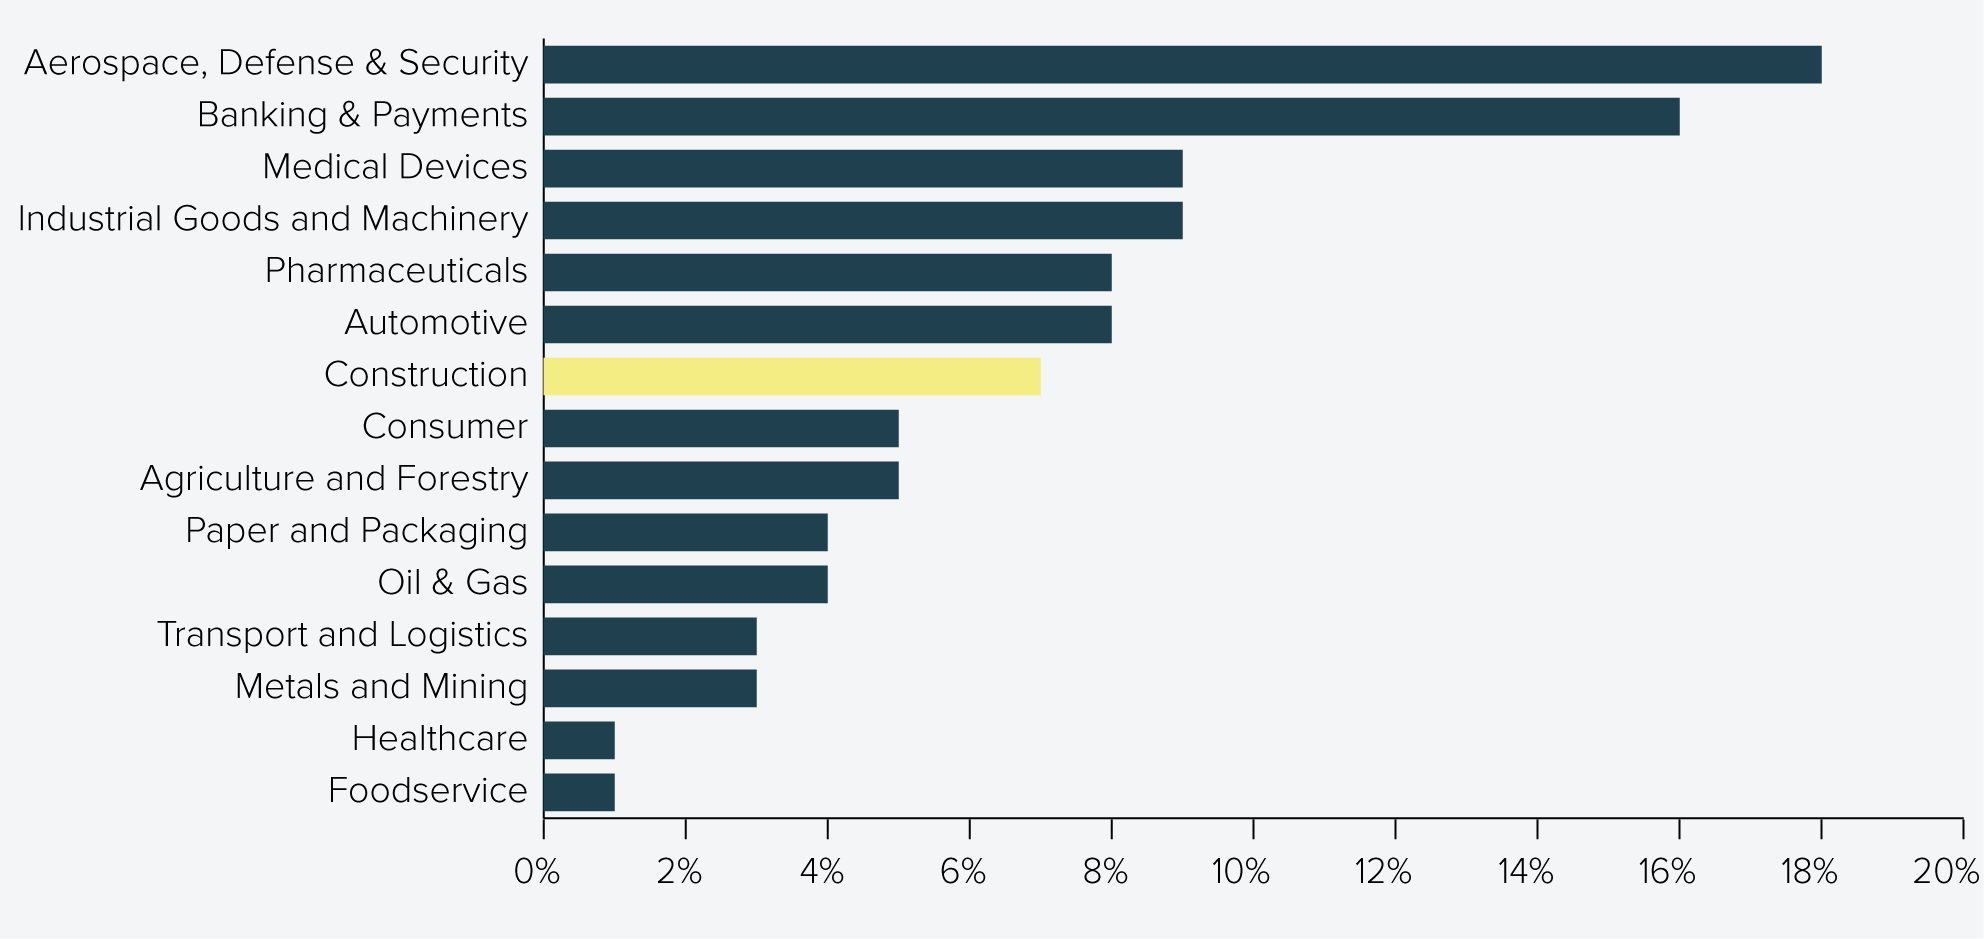
Source: GlobalData (2024)27
Figure 19: Overall strength of technology themes referenced in global construction job postings (2023-2024)
Source: GlobalData (2024)28
A majority of organisations have invested in workforce upskilling over the last 12 months, with engineers and designers leading the charge
Infrastructure Australia’s Industry Confidence Survey finds that two thirds (66%) of the sector have invested in workforce upskilling over the last 12 months. Engineering and design firms are more likely to invest in upskilling with 85% having done so over the last year, reflecting awareness by these professionals of the key skills demand signals for their work – reducing project carbon emissions, energy infrastructure delivery and digitalisation.
Subcontractors are least likely to invest in workforce upskilling, with 33% having not invested over the last 12 months compared to 22% of contractors and consultants.
A quarter (25%) of organisations plan to increase investment in upskilling their workforce in the next 12 months. Those who have invested over the last 12 months are also more likely to increase investment.
Industry is aware of the net zero imperative, but progress is slow
The infrastructure sector is acutely aware of the need to transition to net zero, driven by both the surge in renewable energy projects on the pipeline and government net zero commitments.
At present, just one in five (21%) survey respondents have set their own organisational commitment to carbon reduction and net zero targets. Engineering and design firms (27%), and organisations delivering projects in New South Wales are more likely to set a commitment (33%) than the industry average. Firms delivering public works are also more likely to have set an organisational commitment to carbon reduction than those exclusively delivering private sector work (26% versus 16% respectively).
Of those organisations delivering projects with carbon reduction targets, most felt only up to 10% of projects met targets or were unsure if they had met targets. Figure 20 shows that only 9% of organisations reported that over 75% of their projects met set targets. Companies that set their own carbon commitments are three times more likely to achieve set targets.
While there will be variations in how these targets are defined and considered ‘met’, these results show a low current baseline on net zero targets set and met on construction projects. While the infrastructure sector recognises the urgency of transitioning to net zero, actual commitments and integration of carbon reduction targets into projects remains limited, with significant variation by organisational type.
Figure 20: Percentage of projects in the past 12 months that included carbon reduction targets, and that met carbon reduction targets

Source: Infrastructure Australia Industry Confidence Survey (2025)
Upskilling in net zero needed to lift workforce confidence and capability to decarbonise projects
The Transport and Infrastructure Net Zero Roadmap and Action Plan, released in September 2025, noted that Australia’s workforce will need to be prepared to deliver the net zero transition. This includes improving Vocational Educational Training, improving age and gender diversity of the workforce and addressing training opportunities and digital literacy, especially in rural and remote areas.
There is a high level of upfront carbon awareness in the infrastructure sector. A survey by Infrastructure New South Wales in 2024 found that 90% of government and 95% of industry respondents are aware of upfront carbon and its implications in construction. Yet, as shown in Figure 21, approximately a third of government and a fifth of industry respondents have low confidence in their own capability to reduce upfront carbon.29
Figure 21: Level of confidence in personal capability to reduce upfront carbon
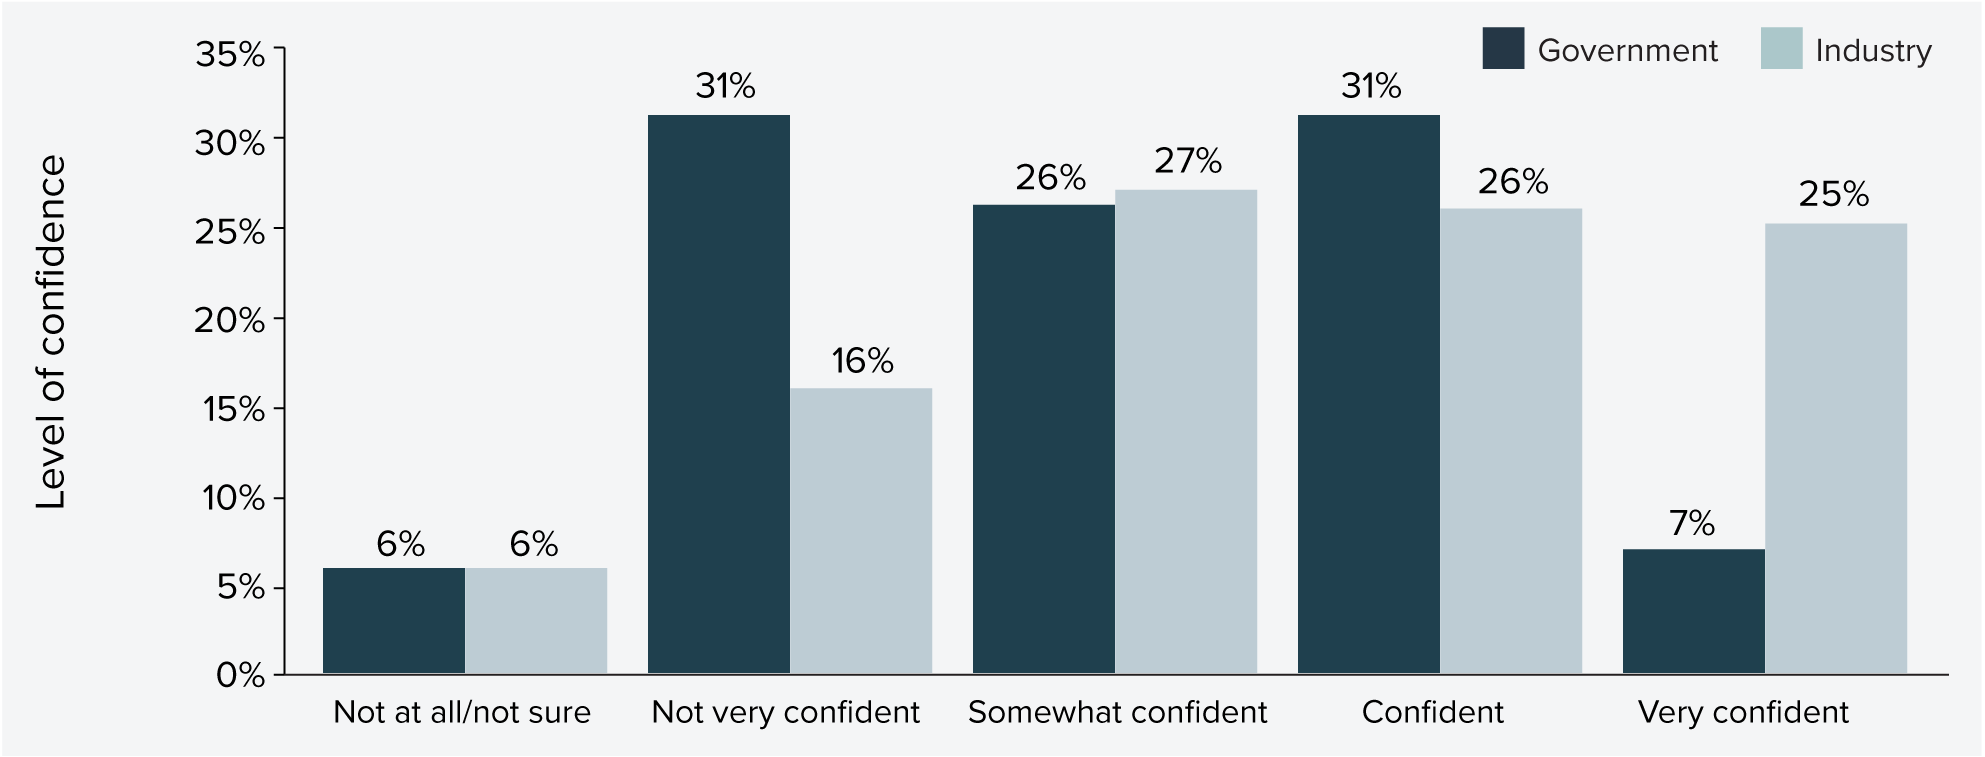
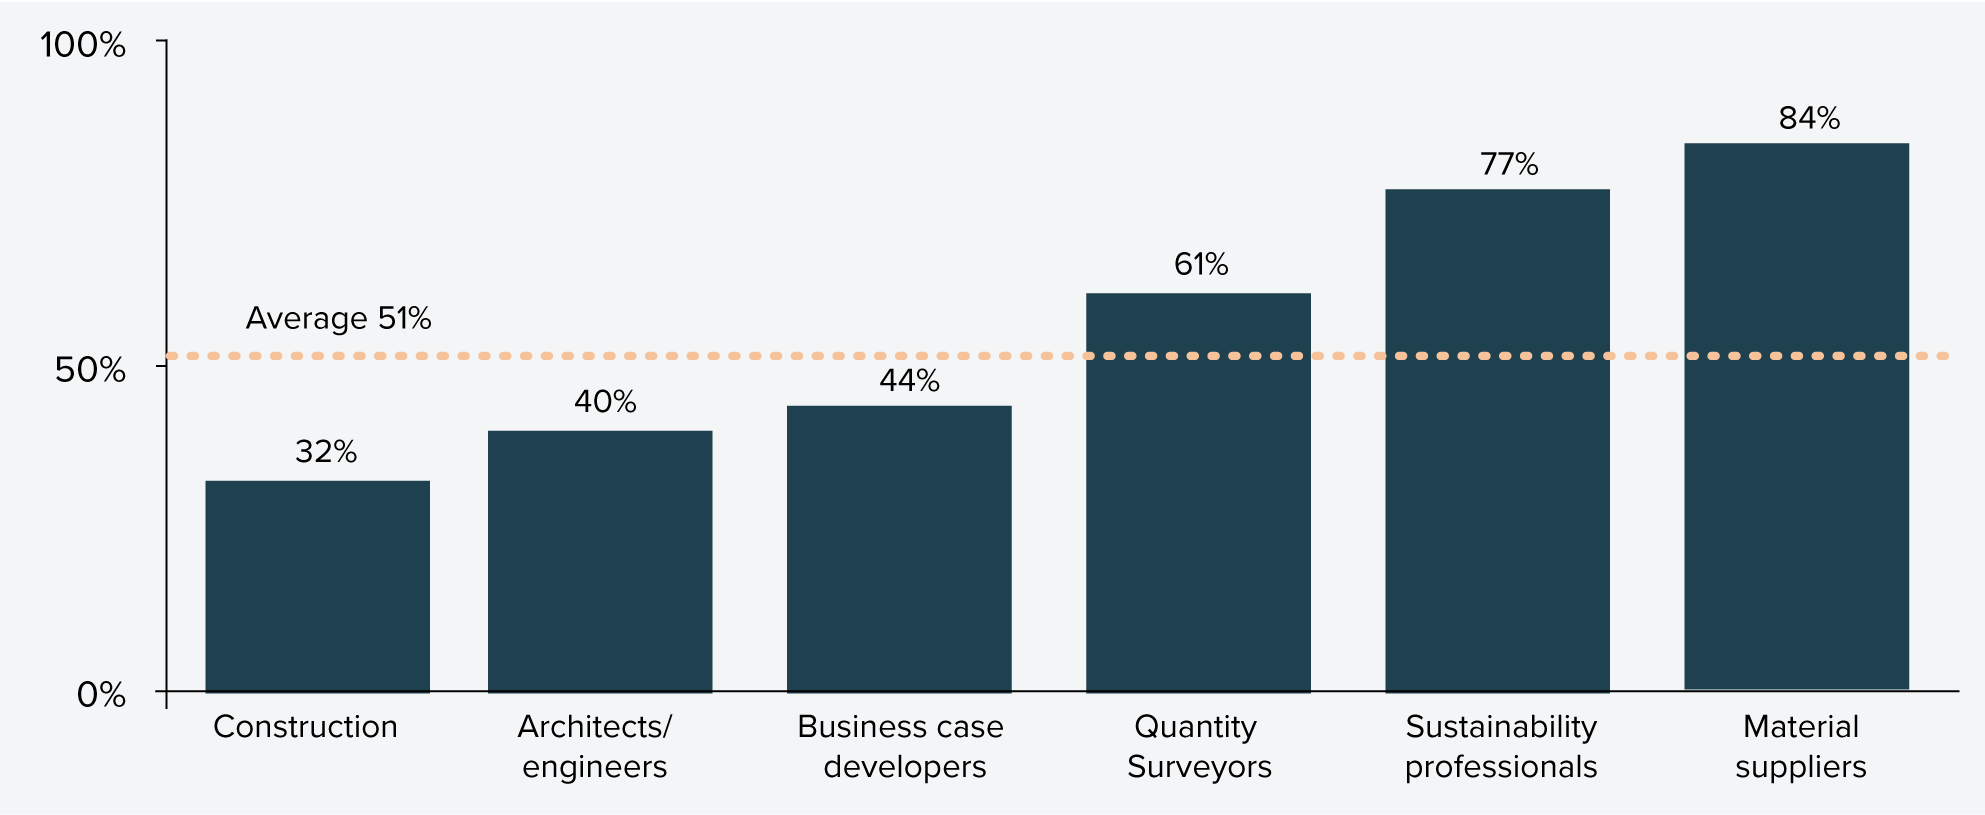
Source: Infrastructure NSW (2025)30
The Delivering Net Zero Infrastructure: Workforce Report, which was led by Infrastructure Australia as part of the Infrastructure Net Zero initiative, found that about a little over half the workforce currently delivering Australia’s infrastructure pipeline are contributing to net zero outcomes.31
The report also found that certain groups of occupations have the highest impact on reducing project emissions across an asset lifecycle. These roles include scientists, engineers, project managers, environmental experts and trades workers, which all have distinct workforce and skilling challenges. The reports recommends an industry-wide training program to upskill these high impact roles and industry leaders on carbon fundamentals to accelerate the path to achieving net zero infrastructure. The Australian Sustainable Built Environment Council and Infrastructure Australia are currently engaging and coordinating across industry and government to scope and progress this recommendation.
Industry calls for more training to upskill workers on net zero
Low levels of organisational commitment and net zero project targets identified in this year’s Industry Survey may reflect limited access to training resources and a lack of perceived need for them. Among surveyed organisations:
- 40% report no access to training for reducing project emissions.
- 25% do not believe training resources are necessary – a view most common among subcontractors, where 39% hold this belief.
- Only 23% have access to the required training resources, with higher access reported by organisations that have set carbon commitments or operate in New South Wales.
Construction workforce training initiatives established around the country
There is an opportunity to create a nationally coordinated approach to emerging construction workforce training programs that address priority skills in digital technologies, modern methods of construction and net zero delivery.
Several targeted initiatives around the country have been recently established to address the need to design and deliver new net zero skills and digital skills to the construction workforce. For example:
- The Melbourne Polytechnic Future of Housing Construction Centre of Excellence (commenced in December 2024) will deliver industry-relevant and innovative training to uplift the technical and digital skills of traditional construction and engineering trades in modern methods of construction. It is co-funded by the Australian and Victorian Governments through the National Skills Agreement.32
- Melbourne Polytechnic’s Clean Economy Skills Lab for Residential Building and Construction (announced August 2024), funded by the Victorian Government, aims to equip workers with expertise in emerging sustainable development and clean energy fields. It will work with industry and TAFE partners to co-design new approaches for clean economy skills development, aligned with industry directions and projected need.
- In New South Wales, the Construction Institute of Applied Technology (opened in February 2024) is focused on future innovations and leadership in construction. Working in collaboration with TAFE NSW, Western Sydney University, and CPB Contractors, it aims to design and deliver market-leading training that rapidly adapts to industry needs. It currently offers a range of short courses on sustainability.
Most of these initiatives are currently at the initial stages of needs definition and testing market demand for new or updated training offerings, with the NSW Construction Institute of Applied Technology the most progressed after having completed its pilot.
CASE STUDY
TAFE NSW Institute of Applied Technology in Construction
The TAFE NSW Institute of Applied Technology in Construction (IATC) pilot delivers innovative, industry-aligned microskills and microcredentials to help meet the state’s growing demand for skilled construction workers.
Delivered in partnership with the NSW Department of Education, Western Sydney University (WSU) and leading industry partners, the TAFE NSW IATC offers short, sharp, online courses that provide learners with targeted, job-ready skills aligned to the sector’s emerging needs.
Its suite of courses covers foundational knowledge in project management, sustainability and digital tools to advanced capabilities in Building Information Modelling (BIM), modern methods of construction, automation and leadership.
Designed to support upskilling and reskilling of the workforce, the courses respond to technological advancements, regulatory changes, and evolving industry best practices.
Outcomes achieved
The TAFE NSW IATC pilot has achieved:
- Almost 50,000 enrolments across 44 microcredentials and 9 microskills.
- A course completion rate of 77%, which is well above the National Centre for Vocational Education Research (NCVER) equivalent average of 42% for comparable courses.
- National reach with students accessing the TAFE NSW IATC courses from every jurisdiction across Australia, including regional and remote locations.
- Strong engagement with diverse cohorts, including women, students with disabilities, Aboriginal and Torres Strait Islanders, mature-age workers, and individuals from culturally and linguistically diverse backgrounds.
Next steps and opportunities
The TAFE NSW IATC is well positioned to help address national workforce shortages by driving capability uplift in housing delivery, licensing reform, and sustainable construction practices through targeted courses that are co-designed with industry to meet emerging skill needs for the construction sector.
Future opportunities include even greater alignment with national priority areas including the National Housing Accord, National Construction Industry Forum (NCIF) Blueprint for the Future, BuildSkills Australia Workforce Plan, and the National Construction Code (NCC).
The TAFE NSW IATC is also heavily focused on meeting equity and net zero priorities, and progressing relevant skills development to support small and medium sized construction businesses to adopt sustainable practices including MCC.
SECTION 3 INDUSTRY VIEWS
Labour remains the top threat to project delivery
Industry continues to rate labour as a key supply risk. Figure 17 shows when asked to rate the severity of a range of disruptions to project delivery, the majority of firms rated cost of labour and labour and skills shortages as a major or significant threat.
Figure 17: Key causes of disruptions to project delivery reported by industry (%)
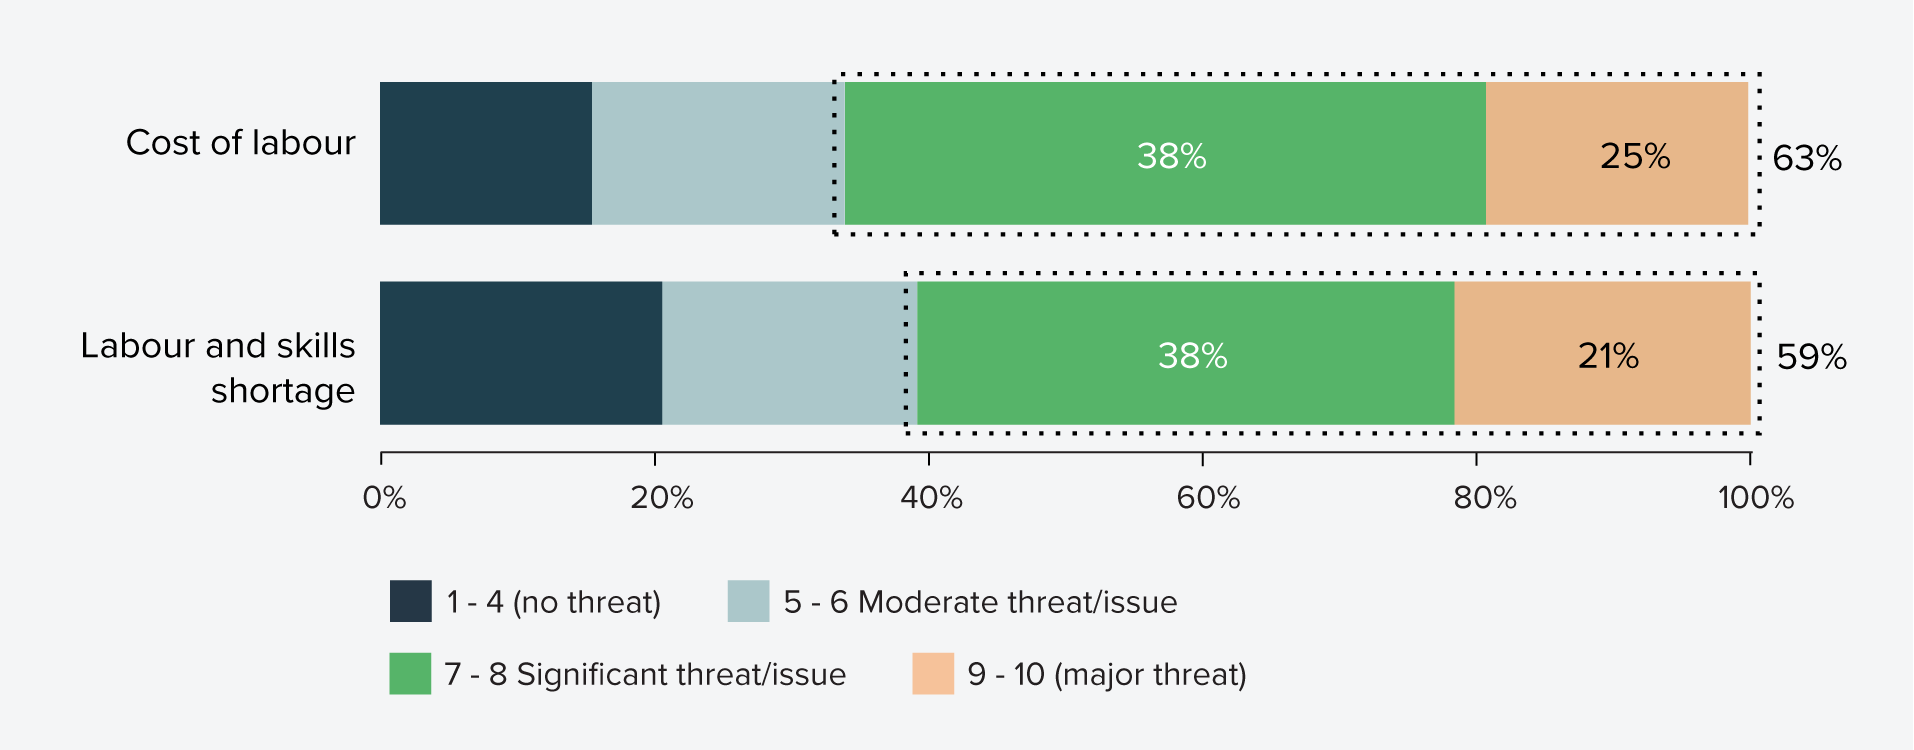
Source: Infrastructure Australia Industry Confidence Survey (2025)
Shortage of critical workers such as engineers and designers will hinder the market’s capacity to service growing subsectors, with many adopting a ‘wait and see’ approach on energy projects
Shortages of critical professionals - especially engineers, designers, and experienced project directors - are constraining capacity in emerging sectors like energy, data centres, defence, and water. Firms are prioritising projects strategically, with many adopting a ‘wait and see’ approach on energy projects due to slow progress and delayed investment.
The Civil Contractors Federation 2025 Survey of its members found that growth in roads, drainage and land development subsectors occurred this year, likely driven by a stable focus on infrastructure and enabling activities to support urbanisation and growth in residential and commercial infrastructure.
While utilities projects have experienced significant growth over the last two years (since 2023-24)—reflecting expansion in electricity, gas, and essential services infrastructure—there has been a small decline in renewable energy projects this year (down 2%). The same survey showed that 33% of contractors were delivering works associated with renewable energy projects, highlighting showing that this sector continues to be a key source of work.
These survey results are consistent with the trends observed in the Major Public Infrastructure Project Pipeline this year showing modest investment growth in transport alongside a doubling of housing and energy projects. At the same time, the slow progress of energy projects through the pipeline, from planning through delivery, has caused firms to continue adopting a ‘wait and see’ stance in boosting workforce numbers and capacities in this emerging sector.
Investment shifts across key sectors also present capability and capacity challenges
Infrastructure Australia’s industry interviews indicate that shifting investment priorities between sectors can create challenges in retaining capability and capacity, particularly in:
- Transport, with major programs moving forward into delivery without the same volume of new projects entering the pipeline, impacting white-collar roles in early planning stages
- Energy, where delays to project start times have stalled local skills investment and prompted some capacity to shift offshore.
- Commercial building, which faces uncertainty amid expectations of increased pressure to deliver residential housing.
Energy infrastructure pipeline uncertainty is prompting companies to adopt a cautious, ‘wait and see’ approach to workforce and skills investment. Rather than committing to long-term training or recruitment, many are relying on redeploying workers from adjacent sectors to meet short-term demand. While this approach offers flexibility, it risks undermining the development of a specialised, future-ready energy workforce.
A more certain energy pipeline, further investment by governments and industry in the apprentice pipeline, and programs to attract a more diverse workforce, are seen as important to growing local labour supply. Improved clarity and confidence on the forward investment pipeline would also help companies make longer term plans to grow and upskill their workforce accordingly.
SECTION 4 SUMMARY: Productivity
Prioritise productivity– future opportunities
4. Governments could explore ways to embed innovation in infrastructure project delivery to unlock significant productivity gains across the construction sector.
This could include:
- Exploring new incentives and investment models to cover the initial upfront cost of demonstrating new innovations on projects, which can then be scaled to wider national adoption and generate transformational productivity uplift across the sector.
- Leveraging government investments in large megaprojects or infrastructure programs with the scale, duration, and strategic importance needed to effectively trial and embed productivity-enhancing innovations.
Summary
Construction industry multifactor productivity (MFP) rose 2.0% in 2023-24, reversing the 2022-23 decline, but the long-term trend remains flat and below mid-1990s levels.
The sector continues to lag broader economy-wide productivity growth.
Subcontracting
- Subcontracting is a cornerstone of Australia’s construction industry, accounting for 41% of infrastructure construction. This means that over $100 billion worth of major public infrastructure projects over the five-year outlook (2024-25 to 2028-29) will be delivered by firms beyond the principal contractor, especially lower-tier and specialist providers.
- The industry view in favour of subcontracting is that it aids in overcoming market constraints such as access to workforce and shortcomings in pipeline certainty where committed projects have been subject to review. However, industry acknowledges it also presents interface risks on large projects, as well as erosion of Tier 1 self-performance, higher supervision costs, and reduced training opportunities for workers.
- The first step to identifying ways to support a healthy and sustainable subcontractor ecosystem is to collect data at the
project level.
Workforce diversity - women’s participation
- Women represent 13% of the construction workforce and only 4% of trades. Construction has the highest gender pay gap (26.3%) compared to the all-industry average (8.9%).
- Less than 50% of firms surveyed by Infrastructure Australia this year had invested in diversity programs in the past 12 months.
- There continues to be progress by governments to increase women’s participation in construction, including completion of the Culture Standard pilots by the Construction Industry Culture Taskforce. Key national initiatives underway such as the National Construction Strategy and National Construction Industry Forum’s Blueprint for the Future have noted national adoption of the Culture Standard as a potential pathway forward.
Uptake of technology & modern methods of construction
- 64% of building and construction firms surveyed have invested in digitalisation in the past year, with investments across BIM, AI, robotics and automation; engineers and designers are leading digital adoption.
- However, approximately a quarter (26%) of firms made no investment in digitalisation, with small business lagging in terms of both adoption and awareness of AI tools.
- The National Cabinet commitment to build 1.2 million homes by mid-2029 is driving innovation in Australia’s residential supply chain, including encouraging state and territory governments to adopt modern methods of construction in pursuit of their housing goals.
- National Competition Policy reforms will target increasing uptake of modern methods of construction by reducing regulatory and licensing barriers in efforts to unlock $45 billion in GDP gains.
- Current procurement models tend to focus on lowest-cost, and project-by-project tendering. This discourages the adoption of scalable innovations like modern methods of construction, digital engineering, and low-emissions materials.
- There is a missed opportunity to better incentivise innovation that carries upfront costs but delivers long-term value and transformative change for the sector. International examples, such as programs in the United Kingdom, Singapore, and United States, show how governments can seed investment in innovation that can be scaled and lift wider industry adoption.
SECTION 4: Productivity
Construction industry productivity growth rose slightly this year, but the long-term trend remains flat
Construction industry multifactor productivity (MFP) rose by 2% in 2023-24, reversing the decline recorded in 2022-23.35 This short-term rebound, however, is not enough to signal a structural shift in industry productivity, as year-to-year MFP changes can be volatile and influenced by assumptions about capital utilisation.
The long-term construction industry trend remains flat, remaining slightly below mid-1990s levels and well below the early 2010s peak. Over the past decade, the sector has consistently lagged productivity growth across the broader economy.
Figure 22: Gross value added multifactor productivity – comparison of construction and comparable industries (1994–95 to 2023–24)
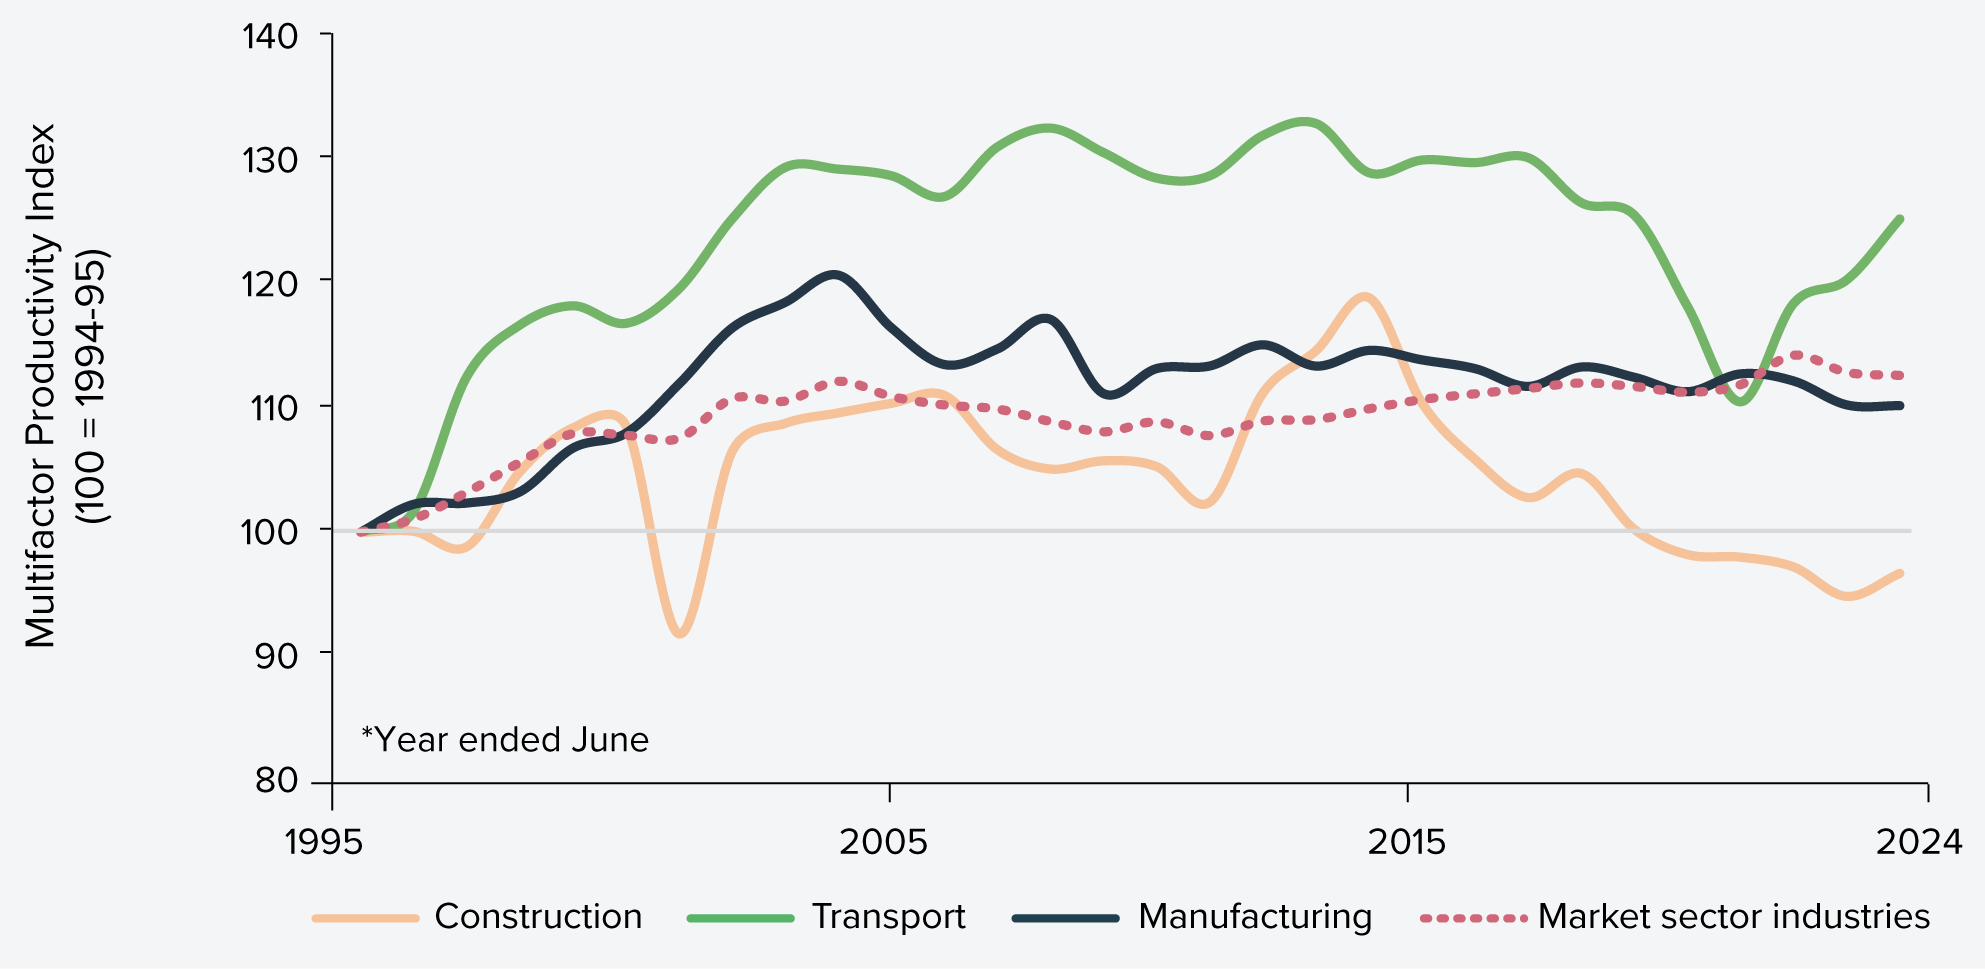
Source: Australian Bureau of Statistics36
Approximately 41% of infrastructure construction is completed by subcontractors
Subcontracting now delivers 41% of infrastructure construction. This is calculated from a bespoke analysis of ABS data, which estimates that 11% of civil and engineering construction and non-residential buildings income comes from subcontracting. At the same time, 30% of costs flow to external construction services.37 As such, nearly half of all infrastructure work is handled by firms beyond the principal contractor, especially lower-tier and specialist providers.
In the context of the current Major Public Infrastructure Pipeline, this means over $100 billion of public infrastructure works funded over the five-year outlook (2024-25 to 2028-29) will be delivered by firms beyond the principal contractor.
Industry stakeholders report a sharp rise in subcontracting over recent decades, driven by fluctuating workloads, risk management, specialist skill needs, regulatory pressures, and evolving project management styles. The growing scale and complexity of projects - often delivered via joint ventures - has further accelerated this shift.
Industry believes subcontracting can deliver productivity benefits, but highlight the need for a more balanced approach to self-performance to reduce integration risk
Infrastructure Australia’s Industry Confidence Survey this year found businesses see the top benefits from subcontracting are access to workers and specialist expertise (voted by over half of businesses surveyed), followed by reduced management and administrative workload (29%) and risk transfer (30%).
There is, however, a range of challenges when managing subcontractors. Figure 23 shows that respondents surveyed this year reported that cost overruns are the most common challenge encountered (reported by 45%), followed by quality inconsistencies (40%), and coordination difficulties (34%). Other challenges encountered include project delays and regulatory compliance (voted by 23% and 16% of surveyed firms).
Optimising subcontracting arrangements is therefore critical to reducing delivery risks and improving productivity. This means moving beyond transactional contracting to models that foster collaboration, transparency, and shared accountability. Better integration between head contractors and subcontractors can reduce costly rework, improve safety outcomes, and enhance workforce stability.
Figure 23: Challenges experienced when managing subcontracting or labour hire relationships
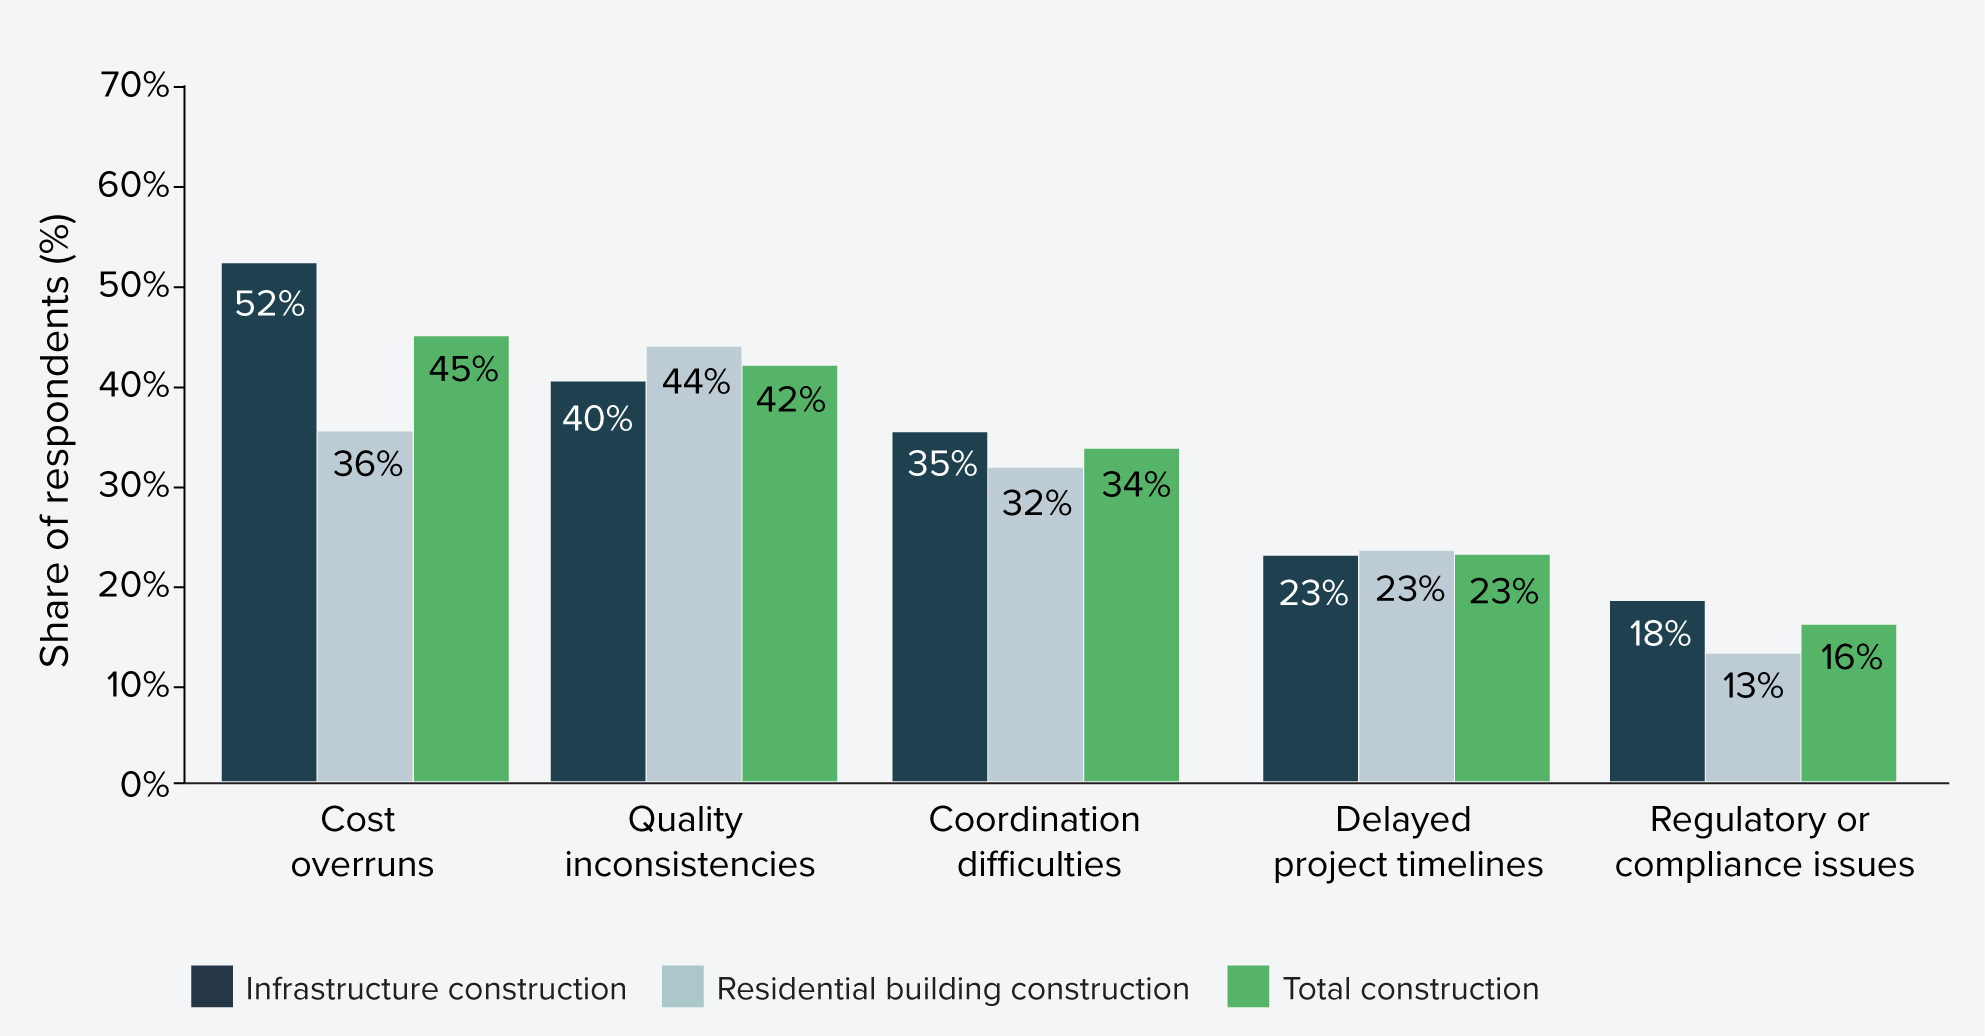
Source: Infrastructure Australia Industry Confidence Survey (2025)
At the same time, strengthening self-performance by Tier 1 contractors is equally important. Maintaining in-house delivery capability supports better sequencing, resource flexibility, and knowledge retention - factors that underpin productivity and resilience. Over-reliance on subcontracting can erode these capabilities, reduce training opportunities, and increase supervisory overheads for head contractors.
However, in depth interviews with contactors revealed that while subcontracting can deliver flexibility and cost benefits, heavy reliance on it has raised concerns about declining self-performance, particularly among Tier 1 contractors that have shifted from delivery to project management roles. Self-performing key tasks supports better sequencing, resource flexibility, and knowledge transfer – factors critical for productivity.
Stakeholders have linked reduced self-performance to weaker outcomes. Extensive subcontracting can dilute training opportunities, strain smaller firms, and force Tier 1 contractors to add costly layers of supervision. Aggressive risk transfer down the supply chain further compounds these issues, creating inefficiencies and integration risks.
Data collection and setting benchmarks are the first steps to unpack impact of subcontracting on productivity
There is no consistent project-level data on subcontracting practices and self-performance. Current reporting does not capture the dynamics of subcontracting – such as the proportion of work subcontracted, the distribution of risk, or the indirect costs associated with layered contracting. Nor does it track the extent of self-performance and its correlation with project outcomes. Without this visibility, it is difficult to identify best practices or diagnose systemic inefficiencies. This aligns with last year’s industry findings, where only 8% of firms reported measuring rework as part of their productivity metrics – highlighting a persistent gap in performance tracking.
Capturing standardised data at the project level can help with developing benchmarks to track the health of the subcontracting ecosystem. This could include metrics on subcontractor engagement, indirect labour costs, and rework rates, alongside contextual project parameters, such as contract type, procurement model, and use of modern construction methods. Establishing these benchmarks will enable governments and industry to compare performance across projects, identify patterns, and target interventions where they will have the greatest impact.
By agreeing on a core set of economic and performance measures – such as budgeted vs actual cost, planned vs actual time, and indirect labour costs relative to total labour costs – the workstream will provide a foundation for evidence-based policy and procurement reform. Over time, these insights could inform strategies to optimise subcontracting arrangements, strengthen self-performance, reduce integration risk, and ultimately lift productivity across the sector.
Workforce diversity
Women make up approximately 13% of the construction industry workforce in Australia and only 4% of trades workers – a trend that has remained stubbornly consistent over the last 40 years since the ABS started collecting Labour Force Survey data.
Looking at a smaller subset of companies with more than 100 employees reporting to the Workplace Gender Equality Agency (WGEA), the construction industry has the highest gender pay gap across all other industries. Figure 24 shows that the median total remuneration gender pay gap for Construction is 26.3%, higher than comparable industries such as Electricity, Gas, Water and Waste Services at 20.4%, mining at 19.9%, and Transport Postal and Logistics at 11.9%, and significantly higher than the all-industry average at 8.9%.
Figure 24: Equal remuneration and gender pay gap for the construction industry (2023-24)

Source: WGEA Industry Data Explorer (2025)40
Women in construction are overrepresented in the lower pay quartiles, part-time work and in lower paid roles. Based on WGEA data in Figure 24, one in five (21%) employees of construction companies are women, yet they make up:
- 38% of workers in the lowest quartile of pay
- 72% of the part-time staff; and
- 6% of technicians and trades workers
This suggests the pay gap is strongly driven by occupation and hierarchical segregation, with fewer women in high earning roles and in leadership positions.
Less than half of industry have invested in diversity, retention or attraction programs in the last 12 months
Despite poor workforce diversity and sustained difficulty in attracting and retaining workers in the construction industry, Infrastructure Australia’s Industry Confidence Survey this year found less than half (46%) of organisations have invested in workforce diversity, retention or attraction programs over the last 12 months, as shown in Figure 25. This contrasts sharply with the same cohort’s stronger focus on other types of productivity-lifting initiatives. Around two-thirds invested in workforce upskilling (66%), and nearly as many invested in data and digitalisation (64%) during the same period.
Figure 25: Percentage of respondents who have invested in upskilling their workforce, data and digitalisation programs, or workforce diversity over the last 12 months
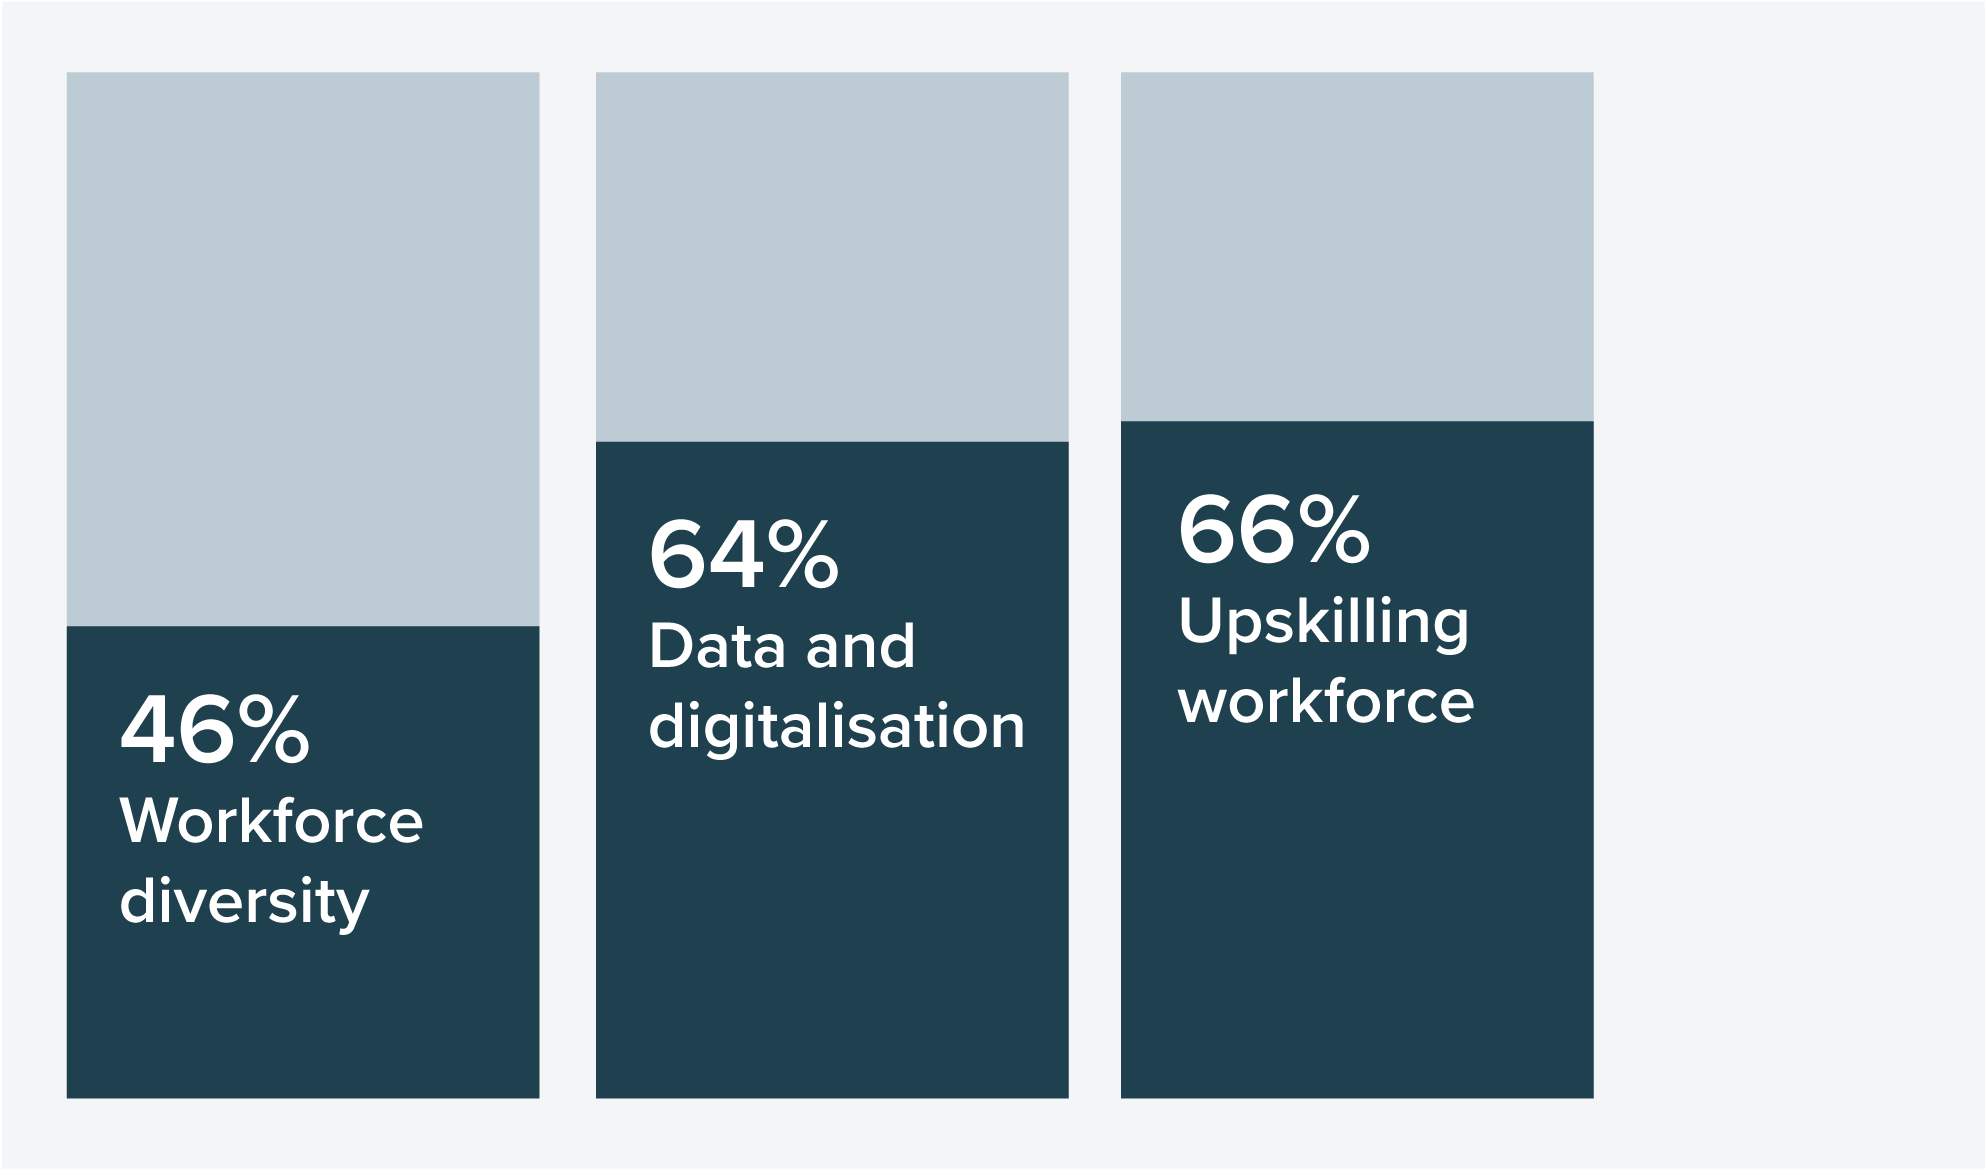
Source: Infrastructure Australia Industry Confidence Survey (2025)
Engineers and designers are more likely to invest (67%) and invest more, with 17% of businesses surveyed investing 11-20% of revenue over the last year. Suppliers are also more proactive than the industry average with 66% having invested in workforce diversity, retention or attraction programs, and 30% investing between 5-10% of revenue.
Meanwhile, 61% of subcontractors did not invest in workforce diversity, retention or attraction programs over the last year.
Of those organisations that have invested in those programs over the last 12 months, close to half (46%) intend to continue to increase investment, while 30% intend to maintain investment, and 12% intend to decrease investment over the next 12 months. Only about 10% of organisations that did not invest this year intend to invest over the next 12months.
Initiatives underway to drive better gender diversity in construction
There is broad recognition of the need to increase women’s participation in construction, and a range of initiatives are in place across industry and governments to drive change.
Under the Federation Funding Agreement Schedule (FFAS) on Land Transport Infrastructure Projects, all governments have committed to optimise their procurement practices to enable an increase in women’s participation at all levels of the construction industry.
Governments are also working on the development of a National Construction Strategy, which includes a workforce workstream that will aim to develop a common set of principles, commitments, and actions to improve workplace culture, enable flexibility, and increase diversity.
It will consider options such as encouraging innovative ideas and best practice, sharing workforce data and lessons, and implementing specific measures such as adopting the Culture Standard (see case study below), enabling flexible work practices like five-day work weeks, and establishing national diversity targets. By embedding these actions into project delivery, the strategy aims to attract and retain a more diverse workforce, reduce turnover, and ultimately improve productivity and sustainability across the sector.
In addition to developing national procurement approaches to boost women’s participation, other entities are working to drive bottoms up cultural change from within, such as the Level the Site project (see case study below).
CASE STUDY
Level the Site – a mentoring program to drive cultural change from within
Level the Site is a joint initiative of the Civil Contractors Federation, Master Builders Australia, the Australian Workers’ Union, Bunnings, and Brickworks. Funded by the Australian Government, the initiative aims to address one of the most pressing challenges in construction retaining women in the workforce.
Industry surveys show that retention is widely recognised as a problem across the sector, with workplace culture consistently identified as a contributing factor. Many in the industry acknowledge that behaviours on site can discourage participation, particularly for women, and that these issues are more likely to be observed by female workers than their male counterparts.
There is strong support across the workforce for practical help to change negative attitudes and drive cultural change that is led internally from within workplaces by employers, managers, and peers.
While regulation can play a role, lasting progress will not be achieved by compliance measures alone. Industry participants themselves say that the most important shifts are attitudinal: equal treatment, less harassment and disrespect, and stronger workplace cultures where women feel supported and valued.
Level the Site is designed to meet that need and aims to build momentum for cultural reform from the ground up. The program delivers:
- Targeted sessions and resources to help employers and supervisors build safe, respectful and inclusive workplaces.
- Mobile trade stalls to showcase construction as a career and highlight opportunities for women.
- Structured peer support and mentoring guidance that connects women with experienced industry role models.
- Social and networking events for women to share experiences and strengthen connections.
- Tool kit talks to give crews the language, awareness, and tools to address workplace culture issues directly.
- An advertising campaign to the broader construction industry communicating the aims of the initiative
The program will be run for three years (2025 to 2028) and support 300 active mentoring partnerships.
CASE STUDY
Pilots of the Culture Standard of the construction industry complete42,43,44,45,46,47
The Construction Industry Culture Taskforce (CICT) developed the Culture Standard to address three major issues in construction: long working hours, poor mental health and wellbeing, and low gender diversity.
The Culture Standard was piloted on five major government infrastructure projects across NSW and Victoria between late 2022 and 2024. Pilots tested the impacts of measures such as capped working hours (≤50 hours/week); five-day work programs instead of six-day rosters; wellbeing initiatives (mental health first aid, flexible scheduling); and diversity actions to increase female participation.
Key findings from the pilots on the adoption of the Culture Standard include:
- Most pilot projects successfully moved to a compressed five-day work week, with only a small reduction in average hours. Workers overwhelmingly preferred this arrangement, indicating improved work-life balance and quality of life.
- There was no clear evidence that the Culture Standard increased project costs or extended timelines. Any minor productivity impacts were generally manageable through planning.
- Adoption of the Culture Standard improved mental health and wellbeing for workers, alongside reduced travel costs due to fewer workdays.
- Turnover on pilot projects was 4.4% lower than the wider workforce average. If scaled across NSW and Victoria, this could save $386–$771 million annually in avoided onboarding and training costs.
- The Culture Standard is expected to help retain experienced workers, particularly women, and attract new entrants, addressing skills shortages.
- Injury frequency rates were on average lower on pilot projects compared to industry benchmarks, though results varied.
- Broader rollout could deliver significant social benefits, including improved wellbeing and reduced costs from turnover and absenteeism. Estimated aggregate travel cost savings alone could reach $52 million per year.
The final evaluation report was released in August 2025, marking the end of the pilot phase of the project. A suite of resources (guides, templates, compliance reporting frameworks) has been developed to support adoption by clients and contractors.
So far, the Australian Capital Territory Government has emedded the Culture Standards in its procurement frameworks for infrastructure projects, while New South Wales and Victoria are exploring options to do the same. While the Queensland Government (through the Department of Transport and Main Roads) and agencies in Western Australia (Department of Finance and Construction Training Fund) have been involved at various stages of the Taskforce as observers.
At the national level, the National Construction Industry Forum (NCIF) has recommended exploring opportunities to implement the Culture Standard nationally (Blueprint for the Future recommendation 4.5) signalling consensus between workers, employers and the Australian Government on broader national adoption of the Culture Standard.
Uptake of new technologies and modern methods of construction
Most organisations have invested in digital transformation and will continue to do so
Results from Infrastructure Australia’s Industry Survey this year reveals almost two out of three organisations in the building and construction industry (64%) have invested in data and digitalisation over the last 12 months. Approximately 35% spent up to 5% of revenue and one in five (22%) invested between 5-10% of revenue. See Figure 26.
Insights from the in-depth interviews indicate that these digital investments supported a variety of productivity-enhancing technologies, such as:
- Automation and robotics in manufacturing enhance efficiency and safety and reduce labour costs.
- Data monitoring to track performance and enable predictive maintenance.
- Digital tools for operations, such as apps for order tracking and logistics management.
- Building Information Management (BIM), including 3D modelling and design, to improve project coordination and consistency of information, reduce errors and improve communication.
- Artificial Intelligence (AI) and machine learning, such as apps for simple on-site queries, real-time quality checks in manufacturing, and investments in enterprise AI systems integrated with company data.
Figure 26: Percentage of revenue invested in data/digitalisation programs over the last 12 months (%)
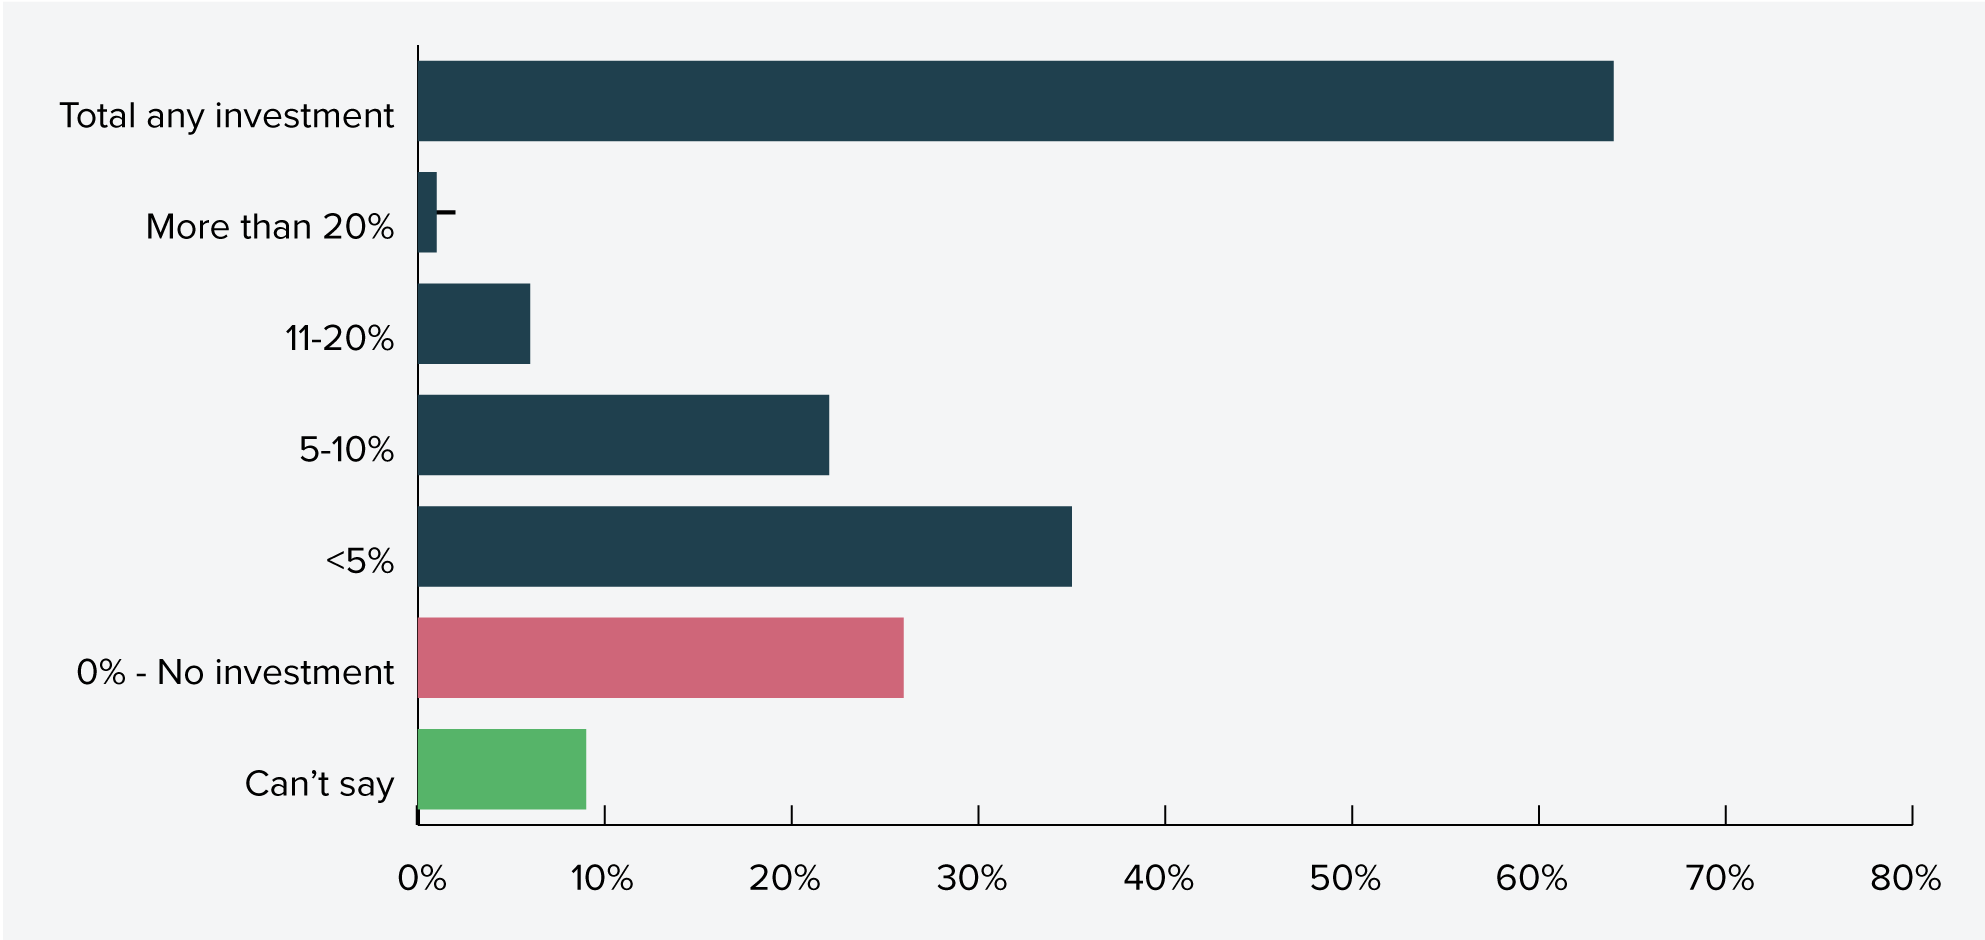
Source: Infrastructure Australia Industry Confidence Survey (2025)
Digital maturity in the industry is growing, led by engineers and designers
Global benchmarks indicate that firms in the growth stage typically allocate around 3–5% of revenue to innovation and R&D for initiatives like integrating data into decision making and automation. Leading innovators often invest 7–10% or more to maintain a competitive edge, particularly in areas such as advanced analytics, AI, and digital-first business models.
Applying these benchmarks to this year’s Industry Confidence Survey, approximately a third of building and construction firms (spending up to 5% of revenue on data and digitalisation) are entering the growth stage of adopting digital technologies and another 29% (spending over 5% of revenue on data and digitalisation) are progressing towards digital maturity.
Encouragingly, of the organisations that have invested in data and digitalisation over the last 12 months, almost three quarters intend to either maintain (49%) or increase (25%) their investment over the next year.
Organisations with engineering and design roles are leading the pack, with 85% investing over the last 12 months and 41% intending to increase investment in the coming year. These firms demonstrate a growing emphasis on data-driven decision-making and the integration of data scientists into traditionally engineering-focused teams.
Soundings
Soundings from industry on investments in innovation and new tech in the last 12 months:
“Introduction of robotics … essentially an automatic tagging machine which replaces labour but improves accuracy, safety … also invested in data monitoring through the mills … traceability in terms of understanding mill performance.” (Supplier)
“The biggest cohort of new hires that they’ve had have been data scientists … looking at how they make decisions, seeing if they can make decisions faster, seeing if they can do more with the trends that are in front of them and challenging some of their assumptions” (Industry)
“They put forward an information model; it provides a 3D diagram of the infrastructure that’s being built … rather than thousands of documents that are needed … and then through the life of the project, it also means that there’s a consistent source of information that has all that data.” (Supplier)
“That’s reliant on businesses being profitable … it is very hard to justify investing in your business in automation. But automation is the key to productivity and there has been a lot of investment … of robotics installed.” (Industry)
A quarter of the industry are yet to invest, representing over a third of small and medium businesses
While most building and construction organisations have invested in data and digitalisation in the last 12 months, a quarter (26%) did not. Of the organisations that did not invest this year, only 9% plan to start investing in the next 12 months.
Smaller organisations are far less likely to invest, as shown in Figure 27. Of organisations surveyed this year by Infrastructure Australia, smaller firms (whose largest current project had a capital value of less than $10 million) were most likely to have made no investment in data or digitalisation over the last 12 months (37%) with this cohort representing 89% of those that did not invest. By contrast, construction organisations with higher value projects were far more likely to invest. Only 11% of firms whose largest project was $10-100 million did not invest and this fell to just 4% for firms with projects valued at $101 million or more.
Figure 27: Percentage of revenue invested in data/digitalisation programs by construction organisations over the last 12 months, by current largest value of project
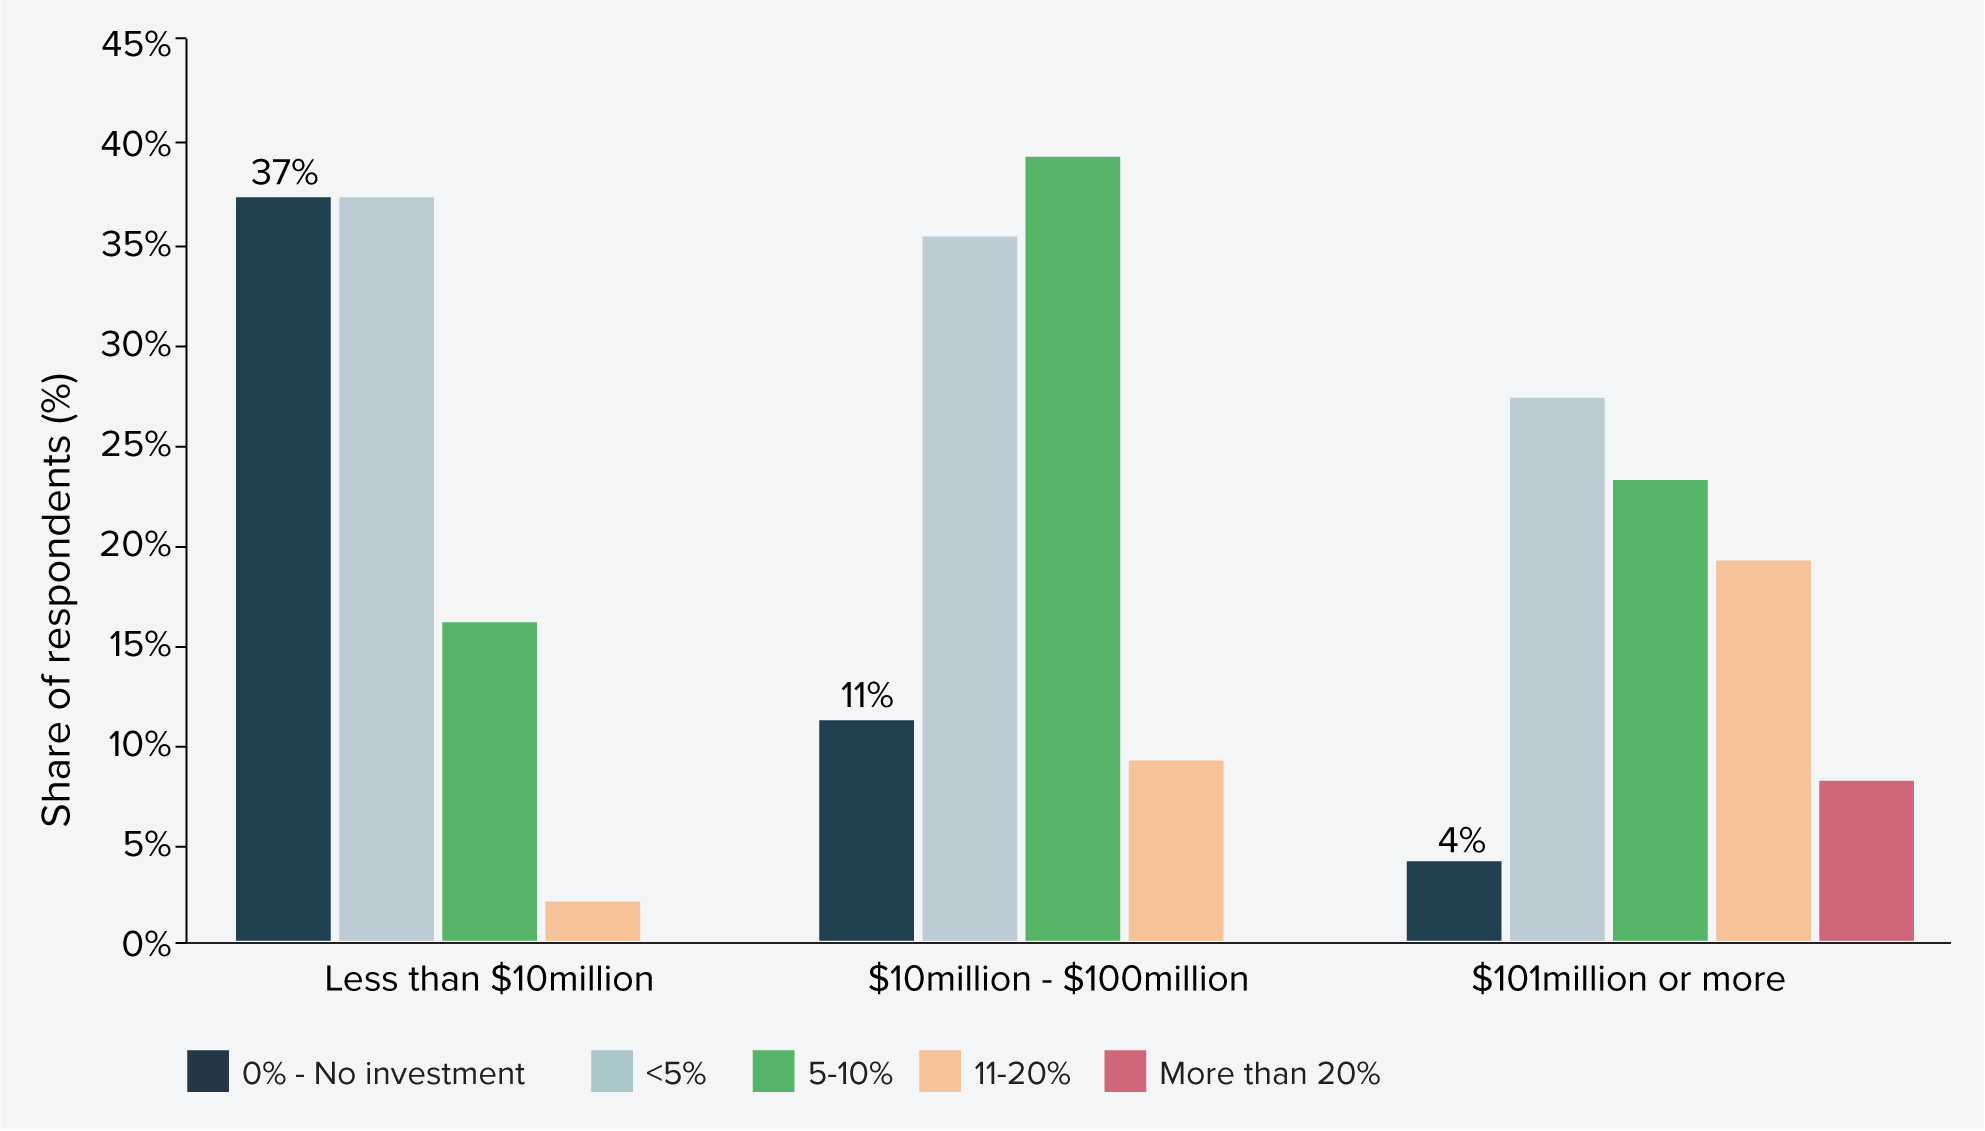
Source: Infrastructure Australia Industry Confidence Survey (2025)
These survey findings are consistent with the National Artificial Intelligence Centre data for small and medium sized businesses (SMEs), which shows 14.3% of construction SMEs use AI, compared to 19.8% across all sectors, as shown in Figure 28. Awareness is also lower – about a third (32.5%) of construction SMEs have no knowledge of AI, versus 22.3% across all sectors.49
Construction industry SMEs based in metropolitan areas (15%) were slightly more likely to be using AI than those in regional Australia (11%), although more significant differences exist between construction firms based on business size.
Figure 28: AI adoption by small and medium enterprises, all sectors and construction sector
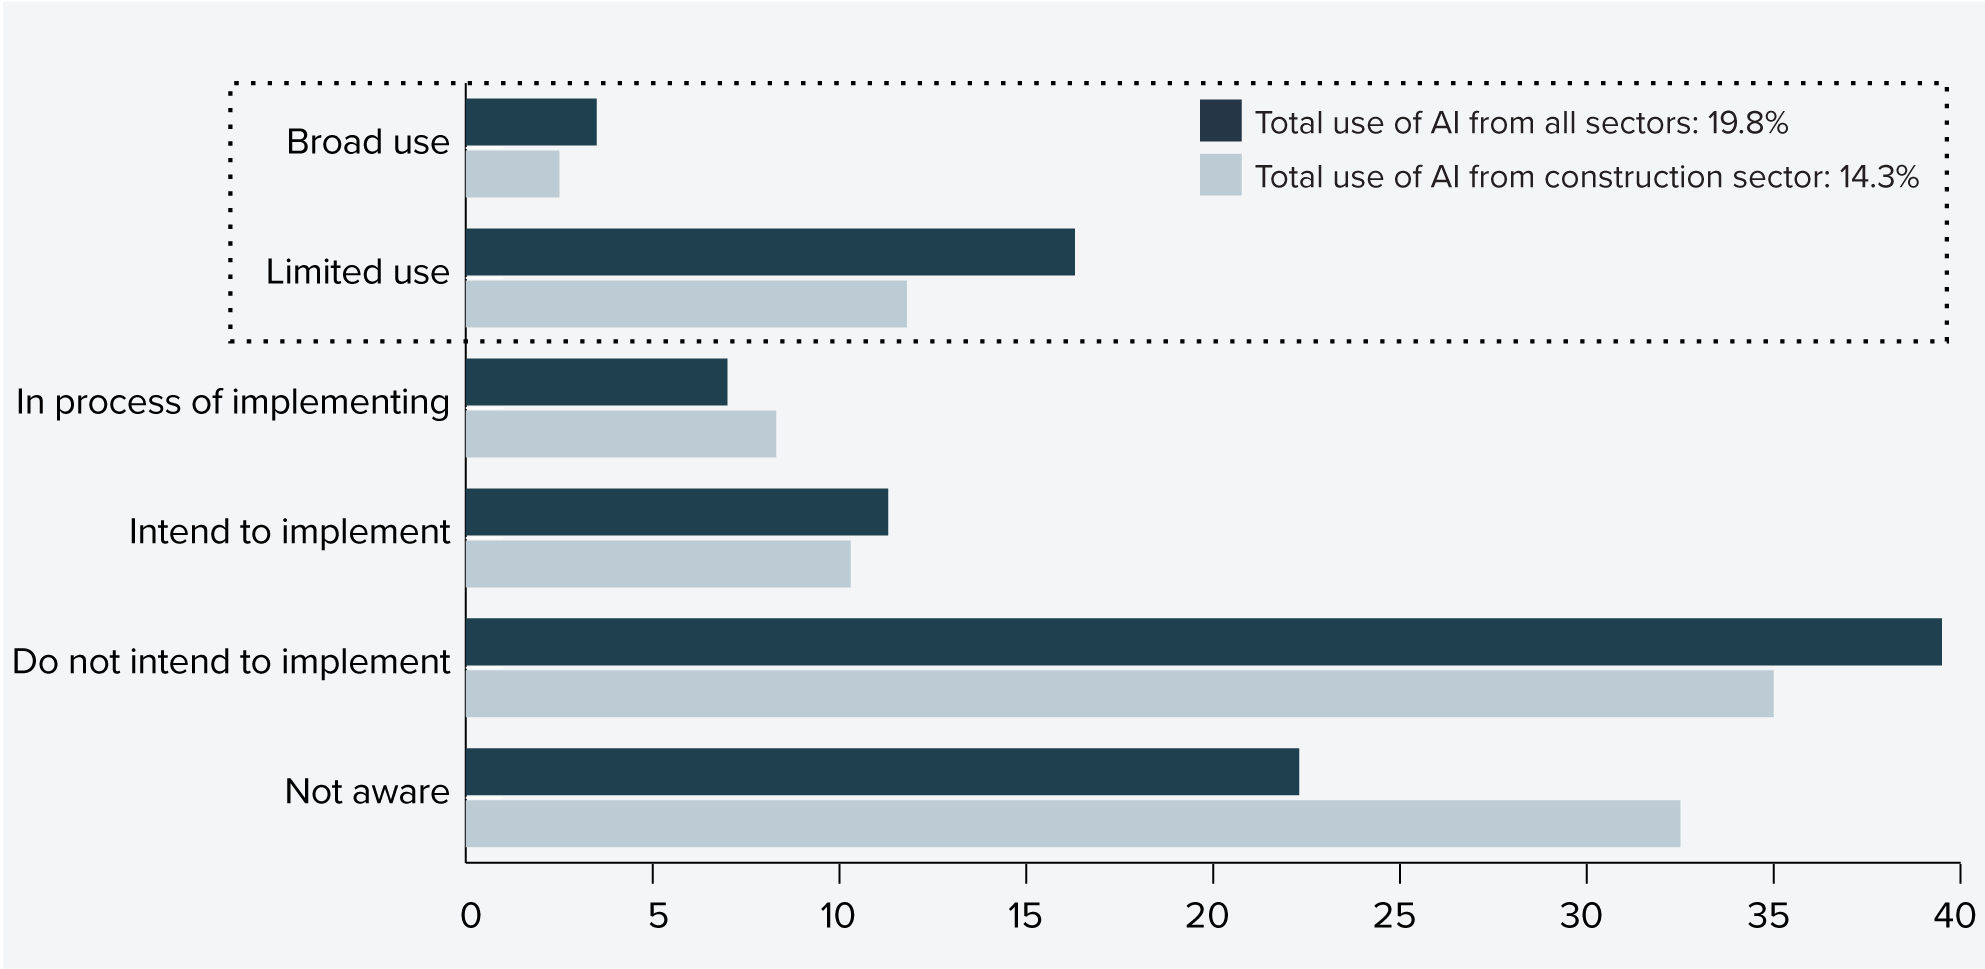
Source: Infrastructure Australia analysis of National Artificial Intelligence Centre AI Adoption tracker data.50
Notes: Data represents average of monthly survey data across 2024 and 2025 year-to-date.
The same data shows about a third (32%) of medium-sized construction firms are not planning to implement or are not aware of AI. This rises to over half (59%) for small construction SMEs, with a quarter (25%) of these firms not aware of AI, as shown in Figure 29.
Figure 29: Artificial Intelligence adoption by construction sector small and medium sized businesses, by organisation size
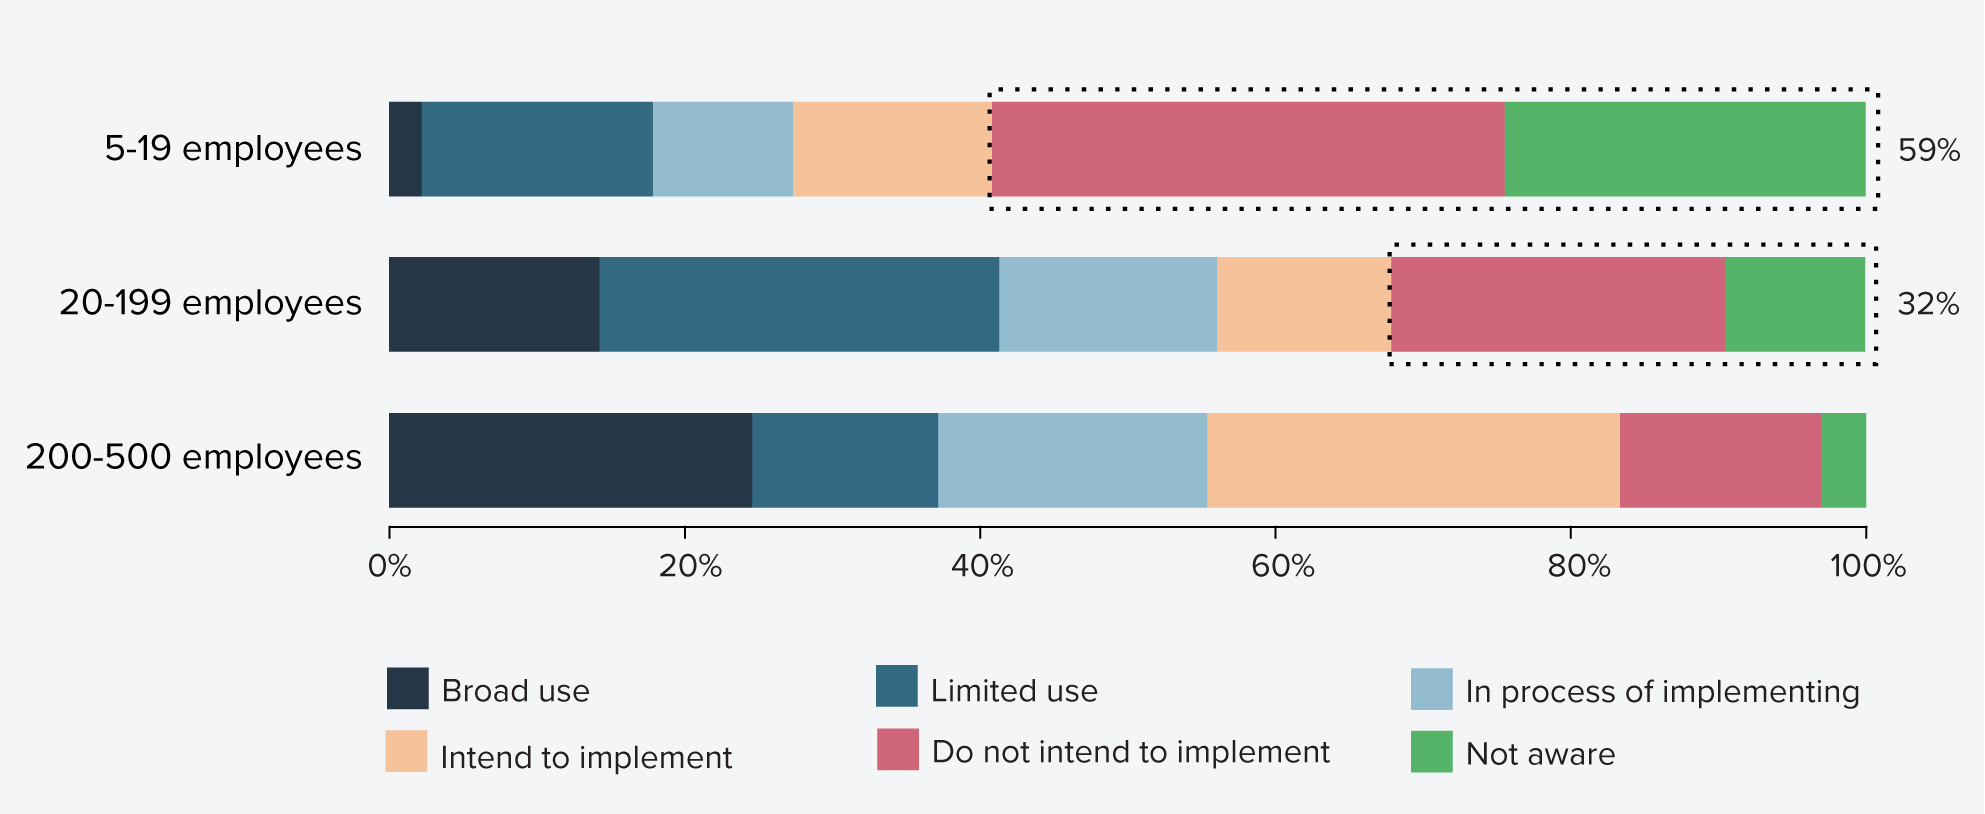
Source: Infrastructure Australia analysis of National Artificial Intelligence Centre AI Adoption tracker data.51
Notes: Data represents average of monthly survey data across 2024 and 2025 year-to-date.
Industry stakeholders interviewed by Infrastructure Australia reported cost as a key barrier to investment in digitalisation, especially for smaller operators. Industry feedback also cited current economic conditions as a hindrance to investment in the last 12 months. Some noted digital transformation is also more challenging where clients continue to rely on paper-based designs and manual processes, or in manual trades where digital tools are seen as less relevant.
Housing is a major motivator and opportunity to drive modern methods of construction adoption
While there is a clear need to, scale-up the capacity and adoption for modern methods of construction, uptake rates of these construction techniques remain low in Australia.
“There has been limited market uptake of modern construction methods, including prefabrication of dwellings or components, due to scale limits.”
National Housing Supply and Affordability Council, State of the Housing System 2025 report52
However, there are signs of increasing adoption and efforts to scale up. The housing supply and affordability crisis is emerging as a prominent driver for action and one of the most significant opportunities to employ modern methods of construction to increase productivity, reduce costs and speed up delivery. This is evidenced by recent progress being made by state governments, with two examples showcased below.
State governments are increasingly looking for modern methods of construction to accelerate new housing
The Queensland Government’s Modern Methods of Construction program is paving the way for faster, smarter, and more sustainable building solutions in Queensland. Led by QBuild, the Queensland Government’s builder and the Office of the Queensland Government Architect, the program addresses the growing demand for housing across the state.
Key Achievements
Since launching in 2022, Queensland’s Modern Methods of Construction program has completed or commenced over 800 homes across the state, with an initial focus on single storey, volumetric modular construction solutions, largely manufactured off-site, transported to their final location and assembled with minimal disruption.
One of the standout projects of the program is the recently completed Bundaberg social housing development. This project comprises six single-storey (class 1) homes built by QBuild in their Rapid Accommodation and Apprenticeship Centre in Zillmere, and six two-storey apartment style (class 2) homes designed, manufactured, and completed by Hutchinson Builders – a tier-1 contractor with Cox Architecture
The Bundaberg project, for instance, was completed in only seven months (post letter of award and including schematic design and construction documentation). It is a precursor of a broader pipeline of more than 200 two and three-storey ‘missing middle’ style dwellings currently under construction.
Lessons learned
The program has demonstrated significant benefits to speeding up delivery and avoiding delays common to traditional construction, such as design revisions or supply chain disruptions.
By using standardised designs and engaging the principal contractor early, the program has reduced project delivery time to around twelve months, including pre-tender feasibility, due diligence, preliminary design and approval processes.
The partnership with the same principal contractor and their design consultant throughout has also fostered innovation and collaboration while reducing the downtime often associated with single phase commissioning.
Next step to scaling wider modern methods of construction adoption
As the program is integrated into the state’s capital delivery pipeline there is an opportunity to further develop agnostic design, contracting and procurement processes. These processes need to value the faster, smarter, and sustainability benefits of modern methods of construction while also allowing the market to determine the best construction methodology and value for money solution to address different housing needs. These needs include the delivery of higher density four to six-storey social and affordable housing projects across the state.
Lessons learnt from the program will also inform the development of a whole of Government modern methods of construction action plan to assist in the delivery of not only housing, but other key government sectors, such as education, health, corrections and the 2032 Olympics.
The NSW Government has made modern methods of construction a strategic priority to boost domestic manufacturing and productivity, enabling faster housing and infrastructure delivery. These commitments are reflected in the NSW Government’s Principles for Partnership with the Construction Sector and Industry Policy.
There are a range of barriers to increasing uptake of modern methods of construction including: pipeline uncertainty, preferences for bespoke design, insufficient industry incentives, unclear planning and regulatory requirements, and knowledge and skills gaps.
Action is underway to overcome these barriers, such as the introduction of modern methods of construction pattern books, updating procurement processes, improving supply chain transparency, revising regulatory settings, providing targeted funding, and delivering capability and skills uplift programs.
NSW Government agencies are already using modern methods of construction in project delivery:
- Landcom is delivering nine two-storey terrace homes in Schofields as a test case for future modern methods of construction housing projects.
- NSW Department of Education is using modern methods of construction to rebuild nine schools impacted by the 2022 floods.
- Homes NSW aims to delivery approximately 13 secondary dwelling demonstration projects using modern methods of construction and volumetric construction in 2025/2026, and a further 80 dual occupancies using a range of modern methods of construction methods in 2026/2027.
- Homes NSW, in partnership with Building 4.0 CRC, is developing a kit-of-parts 2-bedroom apartment prototype and leading program implementation, measurement and evaluation.
The NSW Construction Leadership Group (CLG) coordinates infrastructure planning, procurement, and delivery across the NSW Government. The CLG has established a Modern Methods of Construction Working Group to align NSW Government activities, share lessons, and address systemic barriers to modern methods of construction uptake.
National level initiatives will address regulatory barriers to widen modern methods of construction uptake
Regulatory barriers create challenges for industry to scale up modern methods of construction capacity and propose alternative modern methods of construction delivery options that are equally competitive with conventional construction methods. These regulatory barriers include a lack of design standardisation, which may also create challenges integrating offsite-manufactured components and on-site assembly with traditional construction methods. There remains a need for consistent methods and tools for quality assessment and accreditation. Building codes and operator licensing regulations must also adapt to support standardisation, compliance and competitiveness and enable suppliers to operate across borders.
The Australian Government, in partnership with state and territory governments, will address some of these regulatory barriers through the National Competition Policy reforms.
The National Competition Policy reforms will address barriers to adoption
The National Competition Policy (NCP) reforms will play a pivotal role in increasing the national adoption of modern methods of construction by removing regulatory barriers and incentivising innovation across jurisdictions. Under a ten-year reform program signed in late 2024, the Commonwealth and state governments agreed to modernise competition principles and undertake productivity-enhancing reform, including amending regulatory frameworks that currently favour traditional, onsite construction.53
These initiatives will be complemented by other reforms being progressed through NCP including improved adoption of standards and the development of a national licensing scheme for electrical tradespeople.
Backed by the $900 million National Productivity Fund, these reforms are expected to unlock significant economic benefits, with the Productivity Commission estimating up to $6 billion in GDP gains through faster, lower-cost housing delivery and improved construction productivity.54
In addition to the National Competition Policy reforms, other recent national initiatives announced supporting modern methods of construction include: the Australian Government working with states and territories and stakeholders to streamline the National Construction Code, including removing barriers to the uptake of modern methods of construction,55 additional funding ($49.3 million) to states and territories to boost adoption,56 and development of a voluntary certification scheme to streamline regulatory approvals.57
On the demand side - a clearer pipeline and upfront incentives can scale up innovations, including modern methods of construction, from market-ready to market-wide solutions
While states and territories are actively embedding more modern methods of construction approaches in their own jurisdictions, demand remains fragmented and often limited to individual projects or programs. Governments have collectively invested $44 billion in social and affordable housing, $27 billion in health buildings such as hospitals, and $15 billion in education buildings over the five-year outlook (2024-2025 to 2028-2029). These are all project types with high application potential for modern methods of construction. Further, modern methods of construction approaches have yielded at scale productivity improvements for the transport infrastructure sector such as bridge, rail and metro projects.
While Infrastructure Australia’s Industry Confidence Survey signals growing momentum in investment in digitalisation – particularly among firms in engineering and design – uptake across the broader infrastructure sector remains uneven. Adoption of modern methods of construction and other transformative innovations continues to lag, constrained by entrenched delivery models, fragmented procurement practices, and limited incentives for risk-sharing.
High upfront investment costs and uncertainty around modern methods of construction pipelines can deter industry from scaling modern methods of construction capacity. A more coordinated approach –aggregating projects into strategic pipelines by type – could provide the certainty needed to unlock investment and build capability.
Government clients and industry contractors can often be reluctant to look at innovative ideas and approaches on infrastructure projects, where the focus is often on minimising risks and sticking to standardised methods and technologies. For innovation to succeed, new solutions that can realise productivity gains need to be developed, proven and scaled. Doing so requires systematic approaches designed in a collaborative way by governments and industry.
‘Innovation hub’ models are an important piece of the puzzle for attracting co-investment in research, development and piloting of new technologies and overcoming the ‘valley of death’ between concept and commercialisation. Examples include Australia’s Cooperative Research Centres (CRCs) and the UK’s Catapult Centres. These are vital for taking novel ideas and nurturing them into market-ready products and services. However, they do not address the critical next step of driving uptake and integration of now proven, commercialised but still novel solutions into wider practice.
Where doing so offers clear public benefits, government support can help stimulate markets for demand and build the capacity and scale required to create the supply for proven innovations. In the construction context, a key role for governments is to harness the enormous capital investments made in public infrastructure to drive adoption of innovations that can contribute long-term benefits to productivity across the sector. This means finding structured ways (through levers such as funding, procurement and collaboration) to leverage large-scale infrastructure projects and programs as platforms to support investment in and deployment of innovative solutions, which can simultaneously stimulate demand, help build capacity and skills in government and industry, and demonstrate tangible benefits.
Overseas experience shows that alternative co-investment models between government and industry – at the individual project, infrastructure sector or industry-wide scale – can accelerate the uptake of proven but under-used technologies and scale industry capacity and adoption to deliver step changes in productivity and sustainability. Examples from the United Kingdom, Singapore, and the United States are provided below.
United Kingdom: Crossrail Project Innovation Strategy58,59,60,61,62,63,64,65,66,67
Crossrail was a transformational $30 billion rail project to construct the Elizabeth Line through central London from Reading and Heathrow in the west through to Shenfield and Abbey Wood in the east. The project aimed to increase London’s rail capacity by 10% to carry 200 million passengers a year, reduce journey times and improve access, including bringing 1.5 million more people to within a 45-minute journey of the city centre. At its peak, Crossrail involved 75 companies and 10,000 people directly supporting delivery.
In early stages of the project, isolated pockets of innovation were taking place across different suppliers in response to specific challenges and opportunities arising in delivery. While positive, this activity lacked strategic direction, sponsorship, coordination and access to funds. Crossrail established an innovation strategy to provide a systematic way of mobilising and managing innovation during construction. This defined a set of specific challenges as a focus for innovation and – through leadership, governance and engagement – drove a cultural shift towards collaboration across different government department, industry supply chain and on-site delivery organisations.
The strategy encouraged construction firms in the project supply chain to develop innovative products and processes, apply them to the project itself and ensure they were shared. Measures included establishing new key performance indicators in existing contractual incentives, streamlining change management processes and tracking innovation activity and conversion rate of ideas into implementation.
A dedicated innovation program fund (Innovate18) was also developed by inviting tier 1 suppliers to commit to small funding contributions matched by public funds, used to seed-fund new ideas to a stage of demonstrating value and ability to deploy at scale. This fund, supported by a collaborative executive-level steering group, innovation working group, and small program team, promoted a collective approach to investing in and developing innovative solutions.
The fund invested over $665,000 in innovation projects. In the first 12 months, over 400 ideas were submitted with 180 developed into innovative solutions. Benefits were evaluated at between $5 million to $10 million as well as additional intangible benefits in areas such as health and safety and innovation culture. Overall, the adoption of innovations developed through the program demonstrated clear benefits to industry suppliers including increased efficiencies, accelerated delivery schedule, improved environmental performance and reduced health and safety hazards.
Over 100 shared innovations developed out of Crossrail were carried forward to future infrastructure projects, demonstrating how structured innovation strategies can drive systemic change across the construction sector. Examples include:
- Advanced Building Information Modelling (BIM) for integrated design and asset management, which set the benchmark for the UK Government’s BIM Level 2 mandate.
- The Innovate18 platform fostered collaborative idea-sharing and evolved into the industry-wide i3P network.
- Technical innovations such as sprayed concrete lining (SCL) improved tunnelling efficiency and are now widely used in underground works.
- The introduction of digital safety tools for real-time monitoring and compliance, and advanced offsite manufacturing and modularisation, reducing on-site risks and improving delivery speed.
Singapore: Productivity Innovation Project Incentive Scheme68,69,70
Singapore’s construction sector historically relied on low‑skilled foreign labour, resulting in low productivity, rising costs, and inefficiencies. With ambitious housing and infrastructure needs, the government recognised that without action to increase productivity, including accelerating adoption of modern methods of construction and digital tools, industry would struggle to modernise and meet demand sustainably.
Alongside a range of mechanisms to drive modern methods of construction adoption – including to establish Integrated Construction and Prefabrication Hubs and provide structured processes for government procuring entities to integrate modern methods of construction - the government’s Building and Construction Authority (BCA) also introduced the Construction Productivity and Capability Fund (CPCF) to build capability and kick start adoption of innovative solutions in construction that improve productivity.
The CPCF includes several initiatives, including a Building Information Modelling (BIM) Fund and the Productivity Innovation Project (PIP) Incentive Scheme. Launched in 2018, the PIP scheme provides direct government financial assistance to construction firms for innovation projects to de‑risk investments in innovation and accelerate adoption. Grants cover up to 70% of the cost of projects (up to a maximum of $11 million) that develop new capabilities for technology adoption, site process re-engineering and innovation in construction projects and lead to significant site productivity improvement of at least 20%. It primarily supports investments in adoption of productive technologies – such as robotics and automation, integrated digital delivery systems and modern methods of construction.
By 2019, the PIP had helped improve site productivity by 17.6% compared to 2010 levels and meant Singapore was on track to achieve 70% modern methods of construction adoption by 2025 under the government’s Construction Industry Transformation Map. As of 2022, the PIP had funded 78 construction firms to adopt transformative technologies. Examples include a mechanical, electrical and plumbing subcontractor to automate pipe cutting and welding in their off-site factory, resulting in a 40% productivity gain compared to manual processes. Another funding recipient installed an on-site automated drilling and anchoring robot to replace manual processes, increasing productivity by at least 30% as well as improving worker safety. The program was extended to 2025 as part of a further $202 million investment in construction sector innovation programs and incentive schemes.
United States of America: Federal Highway Administration Center for Accelerating Innovation71,72,73,74
The US Federal Highway Administration (FHWA) identified that highway infrastructure projects across the US were often delayed as a result of outdated processes, fragmented coordination, and the slow pace of agencies to adopt proven new technologies, materials and practices, and integrate these into mainstream use. FHWA recognised the need for national mechanisms to accelerate deployment of innovative solutions that could improve productivity and safety and reduce costs.
The FHWA launched several initiatives designed to accelerate innovation in response to inefficiencies in highway project construction, including the Highways for LIFE (HfL) and the Every Day Counts (EDC) programs. Since these programs were created, the FHWA Center for Accelerating Innovation was established in 2012 to build on these programs and provide a focal point for strategic innovation deployment across the country.
HfL was set up in 2005 to create a technology deployment process and offer funding incentives for state and local highway agencies to speed up the use of innovative approaches on highway and bridge construction projects, and more effectively move them into widespread adoption.
Between 2006 and 2014 the program provided over $85 million in funding support for 60 innovation projects across 37 states, supporting the adoption of innovations including accelerated bridge construction techniques, high-performance materials, prefabricated bridge components, precast concrete pavement systems and new approaches to contracting.
One project in Massachusetts involved replacing 14 aging bridge superstructures on Interstate 93 using prefabricated bridge sections constructed off-site, and accelerated construction techniques. The project reduced construction time from 48 to 9 months, substantially reduced the traffic impacts of construction to 550 hours and resulted in a 2% cost saving compared to conventional construction.
The EDC program provides a collaborative innovation management model that identifies proven but under-used innovations and engages state transport departments, local governments and industry to prioritise opportunities for accelerated deployment in each state. State Transportation Innovation Councils (STICs) then set performance goals for adoption of chosen innovations over a two-year cycle and lead implementation. The FHWA provides support to states through deployment teams that offer technical assistance, training and engagement to facilitate technology adoption and integration of solutions into standard practice, as well as financial assistance through STIC incentives (up to US$125,000 per year) and Accelerated Innovation Deployment grants of up to US$1 million to support the costs of deploying innovative solutions on highway projects.
Since the EDC program was established, it has so far supported 57 innovative solutions across seven rounds between 2011/12 and 2023/24. Each state has applied at least 26 of these with some using more than 45, and many innovations now embedded in mainstream practice across the US.
EDC has supported several projects to accelerate modern methods of construction deployment, such as the Prefabricated Bridge Elements and Systems project. This supported adoption of bridge components such as pier columns and caps, beams and decks that could be fabricated concurrently offsite and delivered as needed, rather than having to construct different components and build them sequentially on site – reducing build time, improving safety and reducing traffic impacts.
Endnotes
- Government of South Australia, 2025, State government puts Whyalla steelworks owner in administration, Department for Energy and Mining media release, 19 February 2025, accessed 3 October 2025, available via: https://www.energymining.sa.gov.au/home/news/latest/state-government-puts-whyalla-steelworks-owner-in-administration
- Productivity Commission 2025, Housing construction productivity: Can we fix it?, Australian Government, Canberra, p.30, available via: https://assets.pc.gov.au/research/completed/housing-construction/housing-construction.pdf
- Trades Recognition Australia, 2024, Prioritising and streamlining Skills Assessment for the Construction Industry, Australian Government, accessed 24 October 2025, available via https://www.tradesrecognitionaustralia.gov.au/news/prioritising-and-streamlining-skills-assessment-construction-industry-0
- Australian Bureau of Statistics, 2025, Labour Force Survey, Detailed (Reference period May 2025), four-quarter average data, accessed 24 October 2025, available via: https://www.abs.gov.au/statistics/labour/employment-and-unemployment/labour-force-australia-detailed/may-2025
- Australian Bureau of Statistics, 2024, Construction Work Done, Australia, Preliminary, ‘Table 01. Value of Construction Work Done, by Sector, Chain Volume Measures, Australia’, time series spreadsheet, cat 8755.0., accessed 24 October 2025, available via: https://www.abs.gov.au/statistics/industry/building-and-construction/construction-work-done-australia-preliminary/jun-2024
- Infrastructure Partnerships Australia 2025, accessed 24 October 2025, available via: https://www.infrastructure.org.au/policy-research/energy-infrastructure-plausibility-matrix
- For example, see: Western Australian Department of Finance, 2024, Pipeline of Works, Government of Western Australia, accessed 24 Oct 2025, available via: https://www.wa.gov.au/service/government-financial-management/procurement/pipeline-of-work; Infrastructure NSW, 2025, NSW Infrastructure Pipeline, New South Wales Government, accessed 24 Oct 2025, available via: https://www.infrastructure.nsw.gov.au/industry/nsw-infrastructure-pipeline
- New South Wales EnergyCo, 2025, South West REZ Access Scheme, New South Wales Government, accessed 2 Oct 2025, available via: https://www.energyco.nsw.gov.au/industry/access-schemes/south-west-rez-access-scheme
- Department of Climate Change, Energy, the Environment and Water, 2025, Shared environmental assessments with states and territories, Australian Government, accessed 24 Oct 2025, available via: https://www.dcceew.gov.au/environment/epbc/approvals/state-assessments
- The Hon. Chris Minns, Premier, Infrastructure NSW set to tackle roadblocks in delivering critical infrastructure, media release, New South Wales Government, 12 June 2024, accessed 6 October, 2025, available via: https://www.nsw.gov.au/media-releases/infrastructure-nsw-set-to-tackle-roadblocks-delivering-critical-infrastructure
- Australian Bureau of Statistics, 2025, Producer Price Indexes, Australia, June 2025, cat no. 6427.0. accessed 24 October 2024, available via: https://www.abs.gov.au/statistics/economy/price-indexes-and-inflation/producer-price-indexes-australia/latest-release
- Australian Steel Institute, 2024, Imported fabricated steel briefing paper, Australian Steel Institute, unpublished data
- Australian Steel Institute, 2024, Imported fabricated steel briefing paper, Australian Steel Institute, unpublished data
- Department of Finance, 2022, Commonwealth Procurement Rules- 1 July 2022, Australian Government, Canberra, available via: https://www.finance.gov.au/sites/default/files/2022-03/Commonwealth%20Procurement%20Rules%20-%201%20July%202022%20-%20advanced%20copy.pdf
- Australian Steel Institute, 2024, Imported fabricated steel briefing paper, Australian Steel Institute, unpublished data
- Australian Steel Institute, 2025, Business Risk Index February 2025 results, unpublished data
- Infrastructure Australia 2024, Embodied Carbon Projections for Australian Infrastructure and Buildings, Infrastructure Australia, Sydney, p.20, available via: https://www.infrastructureaustralia.gov.au/embodied-carbon-projections
- The Council on Federal Financial Relations 2024, Federation Funding Agreement – Infrastructure: Land Transport Infrastructure Projects, Schedule, The Treasury, accessed 24 October 2025, available via: https://federalfinancialrelations.gov.au/agreements/land-transport-infrastructure-projects-2024-2029
- Cooperative Research Australia, 2025, Cooperative Research Centres Program, Cooperative Research Austrlaia, accessed 3 October 2025, available via: https://www.cooperativeresearch.org.au/resources/about-the-crc-program-/
- SmartCrete CRC, 2025, About SmartCrete CRC, SmartCrete CRC, accessed 3 October 2025, available via: https://smartcretecrc.com.au/about/
- Department of Infrastructure, Transport, Regional Development, Communications, Sport and the Arts, 2025, Transport and Infrastructure Net Zero Roadmap and Action Plan: Transport Sector Plan, September 2025, Australian Government, Canberra, available via: https://www.infrastructure.gov.au/sites/default/files/documents/transport-and-infrastructure-net-zero-roadmap-and-action-plan.pdf
- Clean Energy Finance Corporation, 2021, Australian buildings and infrastructure: Opportunities for cutting embodied carbon, CEFC, p.68, available via: https://www.cefc.com.au/document?file=/media/ovrkk5l3/australian-buildings-and-infrastructure-opportunities-for-cutting-embodied-carbon.pdf
- SmartCrete CRC, 2025, Insight Paper - Net Zero is under Construction: How sustainability-led procurement can decarbonise concrete, SmartCrete CRC, available via: https://smartcretecrc.com.au/wp-content/uploads/2025/08/INSIGH_1.pdf
- Department of Infrastructure, Transport, Regional Development, Communications, Sport and the Arts, 2025, Transport and Infrastructure Net Zero Roadmap and Action Plan: Transport Sector Plan, September 2025, Australian Government, Canberra, available via: https://www.infrastructure.gov.au/sites/default/files/documents/transport-and-infrastructure-net-zero-roadmap-and-action-plan.pdf
- World Economic Forum, 2025, The Future of Jobs Report 2025, World Economic Forum, Geneva, p.62, available at: https://www.weforum.org/reports/the-future-of-jobs-report-2025/
- GlobalData, 2025, Construction Hiring Activity: Trends & Signals 2024. Report Code: DT0731TR. GlobalData Plc. (supplied)
- GlobalData, 2024, Construction Hiring Activity: Trends & Signals 2024, Tech hiring by Industry. Report Code: DT0731TR. GlobalData Plc. (supplied)
- GlobalData ,2024, Construction Hiring Activity: Trends & Signals 2024, Tech hiring by Industry. Report Code: DT0731TR. GlobalData Plc. (supplied)
- Infrastructure NSW, 2025, Decarbonising Infrastructure Delivery: Capability Survey Results Summary, NSW Government, Sydney, available via: https://www.infrastructure.nsw.gov.au/media/tr1bjfuu/insw-decarb-cap-survey-results-summary.pdf
- Infrastructure NSW 2025, Decarbonising Infrastructure Delivery: Capability Survey Results Summary, NSW Government, Sydney, available via: https://www.infrastructure.nsw.gov.au/media/tr1bjfuu/insw-decarb-cap-survey-results-summary.pdf
- Infrastructure Australia 2025, Delivering Net Zero Infrastructure: Workforce Report, Infrastructure Australia and the Australian Sustainable Built Environment Council, Sydney, available via: https://www.infrastructureaustralia.gov.au/delivering-net-zero-infrastructure-workforce-report
- Melbourne Polytechnic, 2015, Future of Housing Construction Centre of Excellence, Melbourne Polytechnic, accessed 24 October 2025, available via https://www.melbournepolytechnic.edu.au/about-us/future-of-housing-construction-centre-of-excellence/
- Melbourne Polytechnic 2024, Melbourne Polytechnic to lead new Skills Labs supporting Victoria’s clean economy transition, Melbourne Polytechnic, accessed 3 October 2025, available via: https://www.melbournepolytechnic.edu.au/about-us/news-and-events/news/melbourne-polytechnic-to-lead-new-skills-labs/
- The Hon Steve Whan, Minister for Skills, TAFE and Tertiary Education, 2024, $80 million Institute of Applied Technology for Construction Opened in Western Sydney, media release, 20 February 2024, accessed 3 October 2025, available via: https://www.nsw.gov.au/media-releases/80-million-institute-of-applied-technology-for-construction-opened-western-sydney
- Australian Bureau of Statistics 2025, Estimates of Industry Multifactor Productivity 2023-24 financial year, MFP growth in 2023-24, hours worked basis, viewed 24 October 2025, available via: https://www.abs.gov.au/statistics/industry/industry-overview/estimates-industry-multifactor-productivity/latest-release#estimates-of-industry-productivity-2023-24
- Australian Bureau of Statistics 2025, Estimates of Industry Multifactor Productivity, viewed 24 October 2025, available via: https://www.abs.gov.au/statistics/industry/industry-overview/estimates-industry-multifactor-productivity/latest-release
- Australian Bureau of Statistics 2025, Australian National Accounts: Input-Output Tables, 2022-2023, ‘Input by industry and final use category and imports by product group’, data cube: Excel spreadsheet, cat. no. 5209.0.55.001, viewed 6 October 2025, https://www.abs.gov.au/statistics/economy/national-accounts/australian-national-accounts-input-output-tables/latest-release#introduction
- Australian Bureau of Statistics 2025, Labour Force Survey, Detailed, viewed 24 October 2025, available via: https://www.abs.gov.au/statistics/labour/employment-and-unemployment/labour-force-australia-detailed/may-2025
- Workplace Gender Equality Agency (WGEA) 2025, Data Explorer – Industry; private sector reporting 2023-24, WGEA, available via: https://www.wgea.gov.au/Data-Explorer/Industry
- Workplace Gender Equality Agency (WGEA) 2025, Data Explorer – Industry; private sector reporting 2023-24, WGEA, available via: https://www.wgea.gov.au/Data-Explorer/Industry
- Master Builders Australia 2025, Level the Site, Master Builders Australia, accessed 3 October 2025, available via: https://levelthesite.com.au/
- Lingard, H., Turner, M., Pirzadeh, P., Clarke, J., Chan, K., Sun, C., Strazdins, L., LaBond, C., Galea, N., & Wilson, A. 2025, Culture in Construction: Final Report. RMIT University, Melbourne, available via available via: https://www.constructionindustryculturetaskforce.com.au/publication/cict-final-report
- RMIT University, 2025, Work Hour Cultures for Health, Wellbeing and Gender Equality, RMIT, viewed 24 October 2025, available via: https://www.rmit.edu.au/about/schools-colleges/property-construction-and-project-management/research/research-centres-and-groups/construction-work-health-safety-research/projects/work-hour-cultures-gender-equality
- Construction Industry Culture Taskforce 2025, Guide for Embedding the Culture Standard in Construction Procurement, Construction Industry Culture Taskforce, viewed 24 October 2025, available via: https://cict.mymedia.delivery/wp-content/uploads/2025/06/Guide-for-embedding-the-Culture-Standard-in-construction-w.pdf
- Victorian Government, 2023, Procurement Policies – Buying for Victoria, Government of Victoria, viewed 24 October 2025, available via: https://www.buyingfor.vic.gov.au/policies
- New South Wales Government, 2025, Procurement Policy Framework, New South Wales Government, viewed 24 October 2025, available via: https://www.info.buy.nsw.gov.au/policy-library/policies/procurement-policy-framework
- Transport for NSW, 2025, Culture Standard Trial – Mulgoa Road Stage 1, New South Wales Government, viewed 24 October 2025, available via: https://industry.transport.nsw.gov.au/tfnsw/tiip/culture-standard-trial
- World Intellectual Property Organization (WIPO),2025, Global Innovation Index 2025: Tracking global innovation trends and performance, WIPO, Geneva, available via: https://www.wipo.int/web-publications/global-innovation-index-2025/en/index.html
- Department of Industry, Science and Resources, 2025, AI Adoption Tracker, National Artificial Intelligence Centre, Canberra, viewed 24 October 2025, available via: https://www.industry.gov.au/publications/ai-adoption-tracker
- Department of Industry, Science and Resources, 2025, AI Adoption Tracker, National Artificial Intelligence Centre, Canberra, viewed 24 October 2025, available via: https://www.industry.gov.au/publications/ai-adoption-tracker
- Department of Industry, Science and Resources, 2025, AI Adoption Tracker, National Artificial Intelligence Centre, Canberra, viewed 24 October 2025, available via: https://www.industry.gov.au/publications/ai-adoption-tracker
- National Housing Supply and Affordability Council, 2025, State of the Housing System 2025, 21 May 2025, National Housing Supply and Affordability Council, Canberra, available via: https://nhsac.gov.au/reports-and-submissions/state-housing-system-2025
- Department of the Prime Minister and Cabinet, 2025, Intergovernmental Agreement on National Competition Policy, Department of Prime Minister and Cabinet, accessed 24 October 2025, available via: https://federation.gov.au/about/agreements/intergovernmental-agreement-national-competition-policy
- Productivity Commission 2024, National Competition Policy: modelling proposed reforms, Productivity Commission, Canberra, available via: https://www.pc.gov.au/inquiries-and-research/competition-analysis/report/
- Australian Government 2025, Action on Red Tape and Approvals to Build More Homes More Quickly, Treasury Ministers, Canberra, available via: https://ministers.treasury.gov.au/ministers/clare-oneil-2025/media-releases/action-red-tape-and-approvals-build-more-homes-more
- The Hon Clare O’Neil MP, Minister for Housing, Minister for Homelessness, Minister for Cities, Albanese Labor Government Building More Homes More Quickly and Making Them Easier to Buy, media release, The Treasury, Canberra, 24 August 2025, available via: https://ministers.treasury.gov.au/ministers/clare-oneil-2025/media-releases/action-red-tape-and-approvals-build-more-homes-more
- 64 The Hon Clare O’Neil MP, Minister for Housing, Minister for Homelessness, Minister for Cities, Albanese Labor Government Building More Homes More Quickly and Making Them Easier to Buy, media release, The Treasury, Canberra, 24 August 2025, available via: https://ministers.treasury.gov.au/ministers/clare-oneil-2025/media-releases/action-red-tape-and-approvals-build-more-homes-more
- Greater London Authority 2021, Crossrail: The project at a glance, Greater London Authority, London, available via: https://www.london.gov.uk/sites/default/files/crossrail_-_project_at_a_glance.pdf
- Department for Transport and Infrastructure and Projects Authority (UK), 2024, Sponsoring a Major Project: The Crossrail Experience, Department for Transport, London, available via: https://assets.publishing.service.gov.uk/media/664b0afebd01f5ed32793e3e/crossrail-lessons-learned-report.pdf
- Crossrail Learning Legacy, 2015, Innovation Programme Overview, Crossrail Learning Legacy, accessed 24 October 2025, available via: https://learninglegacy.crossrail.co.uk/wp-content/uploads/2016/04/11A_021_Innovation-Programme-OverviewProspectus.pdf
- DeBarro T, MacAulay S, Davies A, Wolstenholme A, Gann D, Pelton J, 2015, “Mantra to method: lessons from managing innovation on Crossrail, UK”. Proceedings of the Institution of Civil Engineers - Civil Engineering, Vol. 168 No. 4 pp. 171–178, available via: http://dx.doi.org/10.1680/cien.15.00008
- Coughlan, D., Diez, R., Comins, J., & Stärk, A, 2017, “Crossrail project: use of sprayed concrete tunnel linings on London’s Elizabeth line”. Civil Engineering, Vol 170 Issue CES, available via: https://learninglegacy.crossrail.co.uk/wp-content/uploads/2017/04/Use-of-sprayed-concrete-tunnel-linings-on-Londons-Elizabeth-line.pdf
- Vernet, A. 2016, Crossrail Innovation Programme: Innovation Evaluation Report, Imperial College Business School, London, available via: https://learninglegacy.crossrail.co.uk/wp-content/uploads/2016/05/11A-003_Crossrail-Innovation-Programme-Evaluation-Report-Final.pdf
- Esri UK 2016, Crossrail - Resource Centre, Esri UK, accessed 24 October 2025, available via: https://resource.esriuk.com/esri-resources/crossrail/
- McKinsey & Company, 2016, Breaking the mold: How Crossrail’s Innovate18 program works, McKinsey & Company, accessed 24 October 2025, available via: https://www.mckinsey.com/capabilities/operations/our-insights/breaking-the-mold-how-crossrails-innovate-18-program-works
- Scholl Sternberg, A. 2020, Crossrail Integration Facility and Test Automation – How an off-site fully automated testing facility increases resilience of complex signalling projects, Crossrail Learning Legacy, accessed 24 October 2025, available via: https://learninglegacy.crossrail.co.uk/wp-content/uploads/2020/10/7G-017-IRSE-News-Crossrail-Integration-Facility-and-Test-Automation-20200915.pdf
- Taylor, M. 2018, Crossrail Project: Application of BIM (Building Information Modelling) and Lessons Learned, Crossrail Learning Legacy, accessed 24 October 2025, available via: https://learninglegacy.crossrail.co.uk/documents/crossrail-project-application-of-bim-building-information-modelling-and-lessons-learned/
- Building and Construction Authority (Singapore) 2018, Guidelines on Productivity Innovation Project (PIP) Scheme - Part of the Construction Productivity and Capability Fund (CPCF), Building and Construction Authority, Singapore, available via: https://www.bca.gov.sg/pip/others/pip_guidelines.pdf
- Building and Construction Authority (Singapore) 2024, Media Factsheets on Initiatives to Support Transformation in the Built Environment Sector, Building and Construction Authority, Singapore, available via: https://www.mnd.gov.sg/docs/default-source/mnd-documents/cos-2024/bca-media-factsheet.pdf?sfvrsn=4682779e_0
- Ministry of National Development (Singapore) 2021, Written Answer to Parliament by Ministry of National Development on outcomes of the Construction Productivity and Capability Fund, accessed 24 October 2025, available via: https://www.mnd.gov.sg/newsroom/parliament-matters/q-as/view/written-answer-by-ministry-of-national-development-on-outcomes-of-the-construction-productivity-and-capability-fund
- Federal Highway Administration (USA), Center for Accelerating Innovation: Every Day Counts (EDC), accessed 1 October 2025, U.S. Department of Transportation, available via: https://www.fhwa.dot.gov/innovation/everydaycounts/
- US Federal Highway Administration (USA) 2019, Every Day Counts Fact Sheet, U.S. Department of Transportation, available via: https://www.fhwa.dot.gov/innovation/everydaycounts/everydaycounts_overview.pdf
- US Federal Highway Administration (USA) 2014, Harnessing the Power of Innovation to improve America’s Driving Experience: Report on the Highways for LIFE Program, U.S. Department of Transportation, available via: https://www.fhwa.dot.gov/hfl/resources/final_report.pdf
- Federal Highway Administration (USA) 2014, Massachusetts Demonstration Project: Reconstruction of Fourteen Bridges on I-93 in Medford Using Accelerated Bridge Construction Techniques - Final Report, U.S. Department of Transportation, available via: https://www.fhwa.dot.gov/hfl/projects/ma_abc_i93_medford.pdf